The market is a zoo. Bulls, bears, hawks, doves, cash cows, dead cats- investors use a menagerie of metaphors to describe the market, its drivers, and its behaviors.
We propose another animal to add to the herd: a duck.
Ducks slide across the water, wakeless and seemingly motionless. But this surface calm belies the vigorous churning of the duck’s feet happening underneath the water’s surface.
As we look into the back half of 2023, we can foresee a scenario where the market behaves like a duck. On the surface, the market may appear to be making little movement, plodding sideways, while under the surface we could see dynamic churning and rotations of market leadership.
One of our key expectations for 2H23 from our mid-year outlook was for lower equity returns in the second half compared to the first half. We observe equity valuations having already re-rated to high levels (this re-rating drove the entirety of 1H23 returns for the S&P 500), leaving much less room for valuation upside in 2H23. We also observe sentiment and positioning that has already shifted from being bearish and underweight to start the year, to bullish and overweight today (though there is further room to get to prior extremes). Lastly, we observe liquidity, which served as a tailwind in 1H23, fading as a boost for markets.
Nowhere have these observations (valuation expansion, positioning chase, and liquidity boost) been more impactful to equity price action than Technology, Growth, and the “Magnificent Seven” stocks, which have dominated market performance and driven the vast majority of year-to-date gains.
On valuations, the broader market, or the “average” stock, did not experience nearly the same degree of valuation expansion. The equal weight S&P 500 trades at just 16.2x forward earnings, in line with its 10-year average, and up just +8% YTD. The S&P 500 trades at 19.8x forward earnings, well above average and +17% YTD. Even more pronounced is the NASDAQ trading at 32.3x forward earnings, just below its 2021 peak valuation and +40% YTD.
On positioning, flows into Technology funds has absolute trounced the rest of the market. According to Deutsche Bank data as of July 5, Technology funds have received over $20B of fund flows over the past year, while Energy has seen $20B of outflows.
On liquidity, we outline here how liquidity is typically most beneficial for Technology, Growth, speculative, and low quality parts of the market.
As the tailwinds of valuation expansion, positioning, and liquidity potentially fade, or at least have less room to improve compared to the beginning of 2023, we may see the break-neck pace of price returns for Technology, Growth, and “Magnificent Seven” begin to slow (of course acknowledging that momentum and the “fear of missing out” are two powerful forces that could perpetuate recent moves).
We could be seeing early signs of this slowing of returns during the 2Q23 earnings season, where strong earnings results in popular Growth names, like Tesla (TSLA) and Netflix (NFLX), are being met with weak stock price action.
If the dominant contributors to 1H23 returns start to slow their ascent, or even reverse some of their recent gains, could we see better price action from the “left behind” portions of the market to offset their weakness?
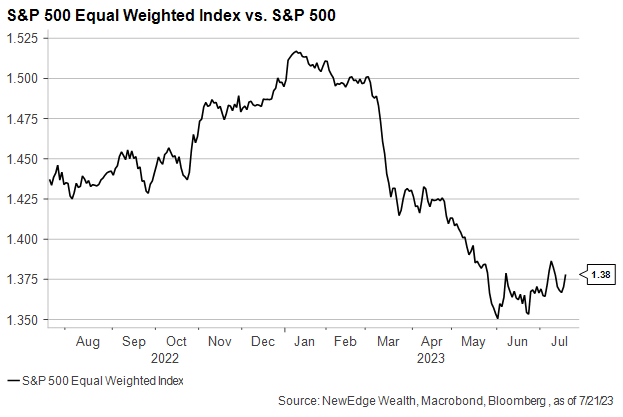
Better economic data and the avoidance of a recession in 2023 should, in theory, be supportive of more cyclical, economically sensitive parts of the equity market (compared to Technology’s idiosyncratic growth, which saw its performance dominance get amplified in the aftermath of regional banking issues, which stoked recession fear). We are seeing some firmer trading in cyclical sectors and industries like Energy, Industrials and Transports, while the Equal Weight S&P has quietly and modestly outperformed the cap weighted S&P 500 since early June.
On net, if we do see a shift in leadership, we could see an overall equity index that trades relatively flat through the end of 2023, but experiences churning under the surface, just like a swimming duck.
Of course, other animal outcomes are possible, either with a continuation of bullish upside or a reversal to bearish downside.
The duck market scenario highlights how, even in markets that appear expensive on the surface, there are potential opportunities and value to be had, mostly for long-term investors.
So if it walks like a duck…
Top Points of the Week
By Ben Lope
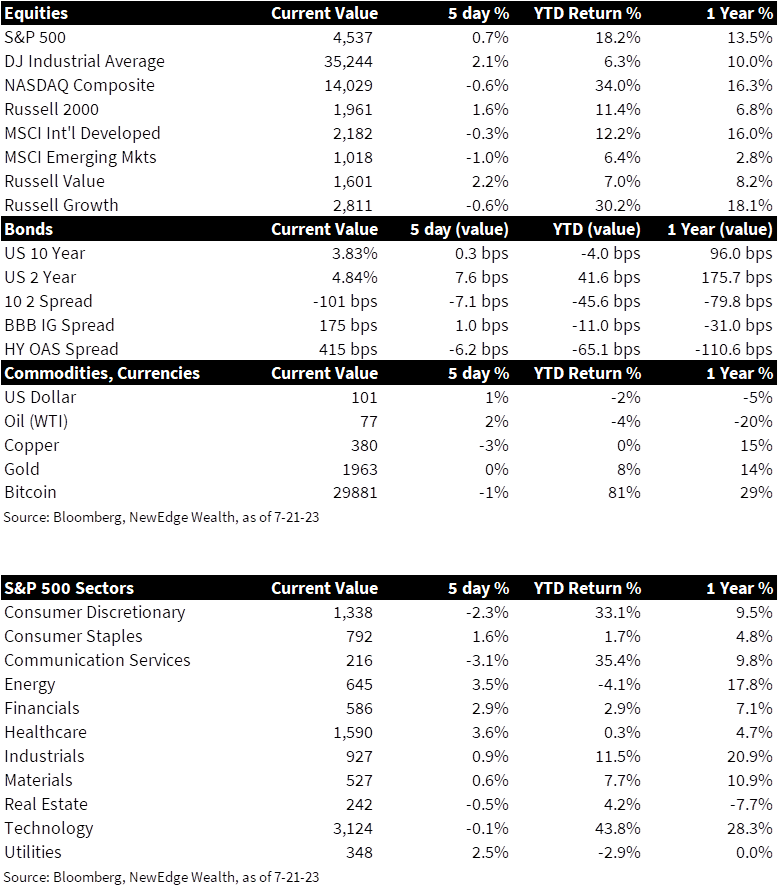
1. US equities mostly higher; international equities slightly lower – Despite the NASDAQ’s modest decline, most US indices were higher on the week. The Dow Jones Industrial Average and Russell 1000 Value index each notched weekly gains of over 2%, topping other major indices. Small caps, as measured by the Russell 2000 index, achieved a second consecutive weekly gain that could be a sign of market strength broadening beyond the largest of the large caps. International developed and emerging markets both ended the week slightly lower.
2. Yield curve inversion moves back above 100bps – Yields on US Treasury bonds stayed in a tight range to start the week before ending modestly higher after Thursday’s lower-than-expected jobless claims figures all but guaranteed that the Fed will move forward with a 25bps hike next week. The 2-10 year yield curve became slightly more inverted, tipping beyond the 100bps mark yet again.
3. Oil prices increase for the fourth week in a row – Oil prices staged their fourth consecutive weekly rally as the market gradually prices in anticipated supply shortages in the months ahead. The modest rally in oil prices allowed the price per barrel of Brent crude to trade above $80, a level that it touched briefly last week for the first time since late April.
4. June Retail Sales mark third monthly increase – June data released by the Commerce Department showed that retail sales grew slower than economists expected but were still up 0.2% month-over-month. More cyclical elements of the retail sales number, such as sales from department stores and gas stations, declined the most. June’s increase marks the third straight month of higher retail sales amidst a backdrop of easing inflation and resilient labor markets.
5. June housing starts fall after huge growth in May – June housing starts came in slightly below economist estimates and were down 8% compared to May, a month that saw a monthly increase in new home construction of almost 22%. June’s figures were also down 8% when compared to the same month last year. Despite the pullback, homebuilders remain confident that the supply shortages in the nation’s existing housing stock will continue to create demand for the construction of new homes, which the National Association of Home Builders (NAHB) estimates to have comprised nearly a third of this spring’s home purchases.
6. Jobless Claims fall to two-month low – Jobless claims registered a two-month low, with Thursday’s release showing that claims fell 9,000 from the prior week to 228,000. Relatively low jobless claims readings over the last four weeks, compared to somewhat heightened levels seen in late May through mid-June, underscore that the labor market is not flashing recessionary signals. Jobless claims are at slightly higher levels now than they were to start the year, but June’s unemployment reading of 3.6% remains well within the Fed’s range of “full employment.”
7. UK June Inflation comes in lower than expected – The UK’s June year-over-year inflation reading came in at 7.9%, below consensus estimates for 8.2%. This positive surprise is good news for the Bank of England, which is currently battling the highest inflation rate among countries that the Organization for Economic Cooperation (OECD) classifies as “advanced.” The market took the announcement as the beginning of a potential disinflation story, as yields on UK sovereign debt moved lower following the release.
8. China Q2 GDP disappoints – China’s post-pandemic recovery produced yet another disappointing piece of data on Monday with the revelation that Q2 GDP grew at 6.3% annual pace, well below the 7.1% pace anticipated by economists. China is on pace to record 5.5% GDP growth in 2023, which is above the government’s target growth rate of 5%, but the relatively low bar, created by a prolonged period of “zero covid” protocols, that these annual figures are being compared to has many analysts predicting that China’s fiscal and monetary policy makers will need to enact more stimulative measures to increases economic momentum and stave off deflation.
9. TSLA & NFLX earnings reveal the challenges of high expectations – 60 S&P 500 companies announced Q2 earnings this week, bringing the total number of Q2 announcements from S&P constituents to 82. Of the companies that have reported, 73% beat earnings estimates and 61% beat sales estimates. TSLA and NFLX offered an interesting view into the limiting factors of high valuations, and therefore high expectations, as each company reported positive Q2 results Wednesday after the close but noted that such growth is likely to moderate in subsequent quarters. This muted guidance caused each stock to open 3-5% lower the following day and may be a sign that market leadership could broaden out beyond the small cadre of names currently propelling indices higher.
10. Next Week: FOMC Meeting & Mega Cap Tech Earnings – The marque event on next week’s economic calendar is the two-day FOMC meeting that begins on Tuesday and is expected to culminate in the Fed’s decision to hike interest rates by an additional 25bps. Other notable economic releases next week include flash readings for July Manufacturing and Services PMIs, July Consumer Confidence figures, and July results for the University of Michigan’s Survey of Consumers. The most anticipated earnings announcements next week include mega cap names Alphabet (GOOGL), Microsoft (MSFT), Meta (META), and Amazon (AMZN).
IMPORTANT DISCLOSURES
Abbreviations: Brent blend: a blend of crude oil extracted from oilfields in the North Sea between the United Kingdom and Norway. It is an industry standard because it is “light,” meaning not overly dense, and “sweet,” meaning it’s low in sulfur content; Flash Services PMI: Flash services PMI is an early estimate of the Services Purchasing Managers’ Index (PMI) for a country, designed to provide an accurate advance indication of the final services PMI data; Flash Manufacturing PMI: Flash Manufacturing PMI is an estimate of manufacturing for a country, based on about 85% to 90% of total Purchasing Managers’ Index (PMI) survey responses each month; FOMC: Federal Open Market Committee; University of Michigan Consumer Sentiment Index: a survey of personal consumer confidence in economic activity, which is used to estimate future spending and saving.
Index Information: All returns represent total return for stated period. S&P 500 is a total return index that reflects both changes in the prices of stocks in the S&P 500 Index as well as the reinvestment of the dividend income from its underlying stocks. Dow Jones Industrial Average (DJ Industrial Average) is a price-weighted average of 30 actively traded blue-chip stocks trading New York Stock Exchange and Nasdaq. The NASDAQ Composite Index measures all NASDAQ domestic and international based common type stocks listed on the Nasdaq Stock Market. Russell 2000 is an index that measures the performance of the small-cap segment of the U.S. equity universe. MSCI International Developed measures equity market performance of large, developed markets not including the U.S. MSCI Emerging Markets (MSCI Emerging Mkts) measures equity market performance of emerging markets. Russell 1000 Growth Index measures the performance of the large- cap growth segment of the US equity universe. It includes those Russell 1000 companies with relatively higher price-to-book ratios, higher I/B/E/S forecast medium term (2 year) growth and higher sales per share historical growth (5 years). The Russell 1000 Value Index measures the performance of the large cap value segment of the US equity universe. It includes those Russell 1000 companies with relatively lower price-to-book ratios, lower I/B/E/S forecast medium term (2 year) growth and lower sales per share historical growth (5 years). The BBB IG Spread is the Bloomberg Baa Corporate Index that measures the spread of BBB/Baa U.S. corporate bond yields over Treasuries. The HY OAS is the High Yield Option Adjusted Spread index measuring the spread of high yield bonds over Treasuries. S&P Equal Weight Index (S&P EWI) is the equally-weighted version of the widely regarded S&P 500® Index, which measures 500 leading companies in leading U.S. industries. The S&P EWI has the same constituents as the capitalization weighted S&P 500® Index, but each company in the S&P EWI is allocated a fixed weight, rebalancing quarterly.
Sector Returns: Sectors are based on the GICS methodology. Returns are cumulative total return for stated period, including reinvestment of dividends.
The views and opinions included in these materials belong to their author and do not necessarily reflect the views and opinions of NewEdge Capital Group, LLC.
This information is general in nature and has been prepared solely for informational and educational purposes and does not constitute an offer or a recommendation to buy or sell any particular security or to adopt any specific investment strategy.
NewEdge and its affiliates do not render advice on legal, tax and/or tax accounting matters. You should consult your personal tax and/or legal advisor to learn about any potential tax or other implications that may result from acting on a particular recommendation.
The trademarks and service marks contained herein are the property of their respective owners. Unless otherwise specifically indicated, all information with respect to any third party not affiliated with NewEdge has been provided by, and is the sole responsibility of, such third party and has not been independently verified by NewEdge, its affiliates or any other independent third party. No representation is given with respect to its accuracy or completeness, and such information and opinions may change without notice.
Investing involves risk, including possible loss of principal. Past performance is no guarantee of future results.
Any forward-looking statements or forecasts are based on assumptions and actual results are expected to vary from any such statements or forecasts. No assurance can be given that investment objectives or target returns will be achieved. Future returns may be higher or lower than the estimates presented herein.
An investment cannot be made directly in an index. Indices are unmanaged and have no fees or expenses. You can obtain information about many indices online at a variety of sources including: https://www.sec.gov/answers/indices.htm.
All data is subject to change without notice.
© 2025 NewEdge Capital Group, LLC