
Weekly Summary: July 19 – 23, 2021
Key Observations:
- Investor convictions appear to be rather shallow in many instances and easily affected by price swings.
- Interest rates went too low and the prices of Value and Cyclical stocks went too low, as well, relative to “fundamentals” as we presently understand them.
- Extreme price movements on Monday, which merely accentuated trends already in place, provided attractive entry points to buy Value and Cyclical stocks. For the more adventuresome, given that the Treasury market is a “manipulated” market, it also provided a fresh opportunity to short 10 Year Treasuries (if expect higher rates as we do).
- We believe that the Delta variant will slow but not derail continued economic growth.
- The perceived slowdown in economic growth rates has often been due to supply disruptions and labor shortages and sometimes even marginal slips in confidence levels, which have also been influenced by inflation concerns.
The Upshot: We believe that Carpe Diem is the appropriate mindset to take advantage of attractive entry points as they present themselves and add to desired positions.
Financial markets are plagued by many uncertainties. Investor convictions appear to be very shallow. Unpredictable market reactions sometimes make it difficult for those with deeper conviction levels to maintain their positions. Like many other investors, we believe that interest rates are too low when compared to “fundamentals” of inflation, inflation expectations and U.S. and global GDP growth rates. In an attempt to quantify this mismatch, JP Morgan’s U.S. bond strategy team stated that “The current level of Treasury yields imply a relatively pessimistic growth outlook: the current level of yields would be justified if we lowered our growth forecasts by nearly 3 percentage points, implying just 0.5% real growth over the next year.” Inflation wasn’t even mentioned! Even though inflation expectations over the past few months have been relatively stable-to-rising, they have had virtually no effect on financial markets. Perhaps it’s now all about economic growth. But very few see any short-term catalyst that would change this dynamic.
This past Monday perhaps did show us the needed catalyst. In fact, it was a rather classic confluence of factors that showed us that in some instances, price itself could be a catalyst. The extreme downdraft of U.S. Treasury yields, Value and Cyclical sectors and Energy prices all provided classic opportunities to take positions assuming a quick reversal of these downdrafts. One day’s trading, of course, rarely provides these opportunities. What was “classic” about these opportunities was that they came at what appeared to be at the “end” of price movements that were merely exacerbated on Monday. There was really little new data. Although news reports surfaced that the U.S., U.K. and some of their allies accused China of being the mastermind behind a series of malicious ransomware, data theft and cyber espionage, we don’t believe that those reports were the reason why the S&P had its worst day in two months. Likewise, the OPEC+ agreement over the prior weekend to start increasing its oil production was not a huge surprise. Even so, WTI was lower by over 7% on Monday, having its worst daily decrease since April 2020. Instead, Delta variant worries and general worries about economic growth appeared to be the principal catalysts for the Monday downdraft.
The reason that this new focus was able to cause such a downdraft was that these trends were already in place for weeks or even months in some instances. In last week’s letter, we said that investors should “selectively take advantage of the lowered prices of Value and Cyclical stocks.” More specifically, we said that “it is time to revisit buying bank stocks, especially as interest rates show signs of bottoming.” Among the best performing S&P sectors the next 2 days were Industrials, Financials and Energy. The last 2 days this week reverted to defensive and growth sectors outperforming. To take advantage of the volatility of any asset price, one must have a plan of action and then be ready. Carpe Diem.
Source: J.P. Morgan, Equity Strategy: Q2 Earnings: This reporting season potentially offers a different setup versus the last one, (7/19/21)
This is a very opportunistic type of market environment. Investors must “seize the day.” When the opportunity presents itself, one must act. In this market, we simply can’t afford to wait for an “appropriate” catalyst. Sometimes it really is just a matter of price. Markets are discounting mechanisms. On Monday, it finally appeared that certain sectors, interest rates and other assets which were in downtrends, had finally discounted enough potential unfavorable economic news and future low inflation rates, so as to provide very attractive risk/reward entry points. We do not believe that investors should “chase” anything in this market environment, least of all overall equity averages such as the S&P 500, which is still very close to its all-time high. This does not mean it can’t go higher, and rather that the risk/reward is not favorable to adding to such more general positions. Likewise, we would not add to growth stocks at this juncture, as they have already discounted most of the potential good news and little of the more potentially negative possible developments. We continue to hold the bulk of our big cap quality growth stock positions, however. This is why we have been pursuing a “barbell” approach in our equity positioning. This week has also shown that patience is a necessary corollary to an opportunistic approach in the current market environment.
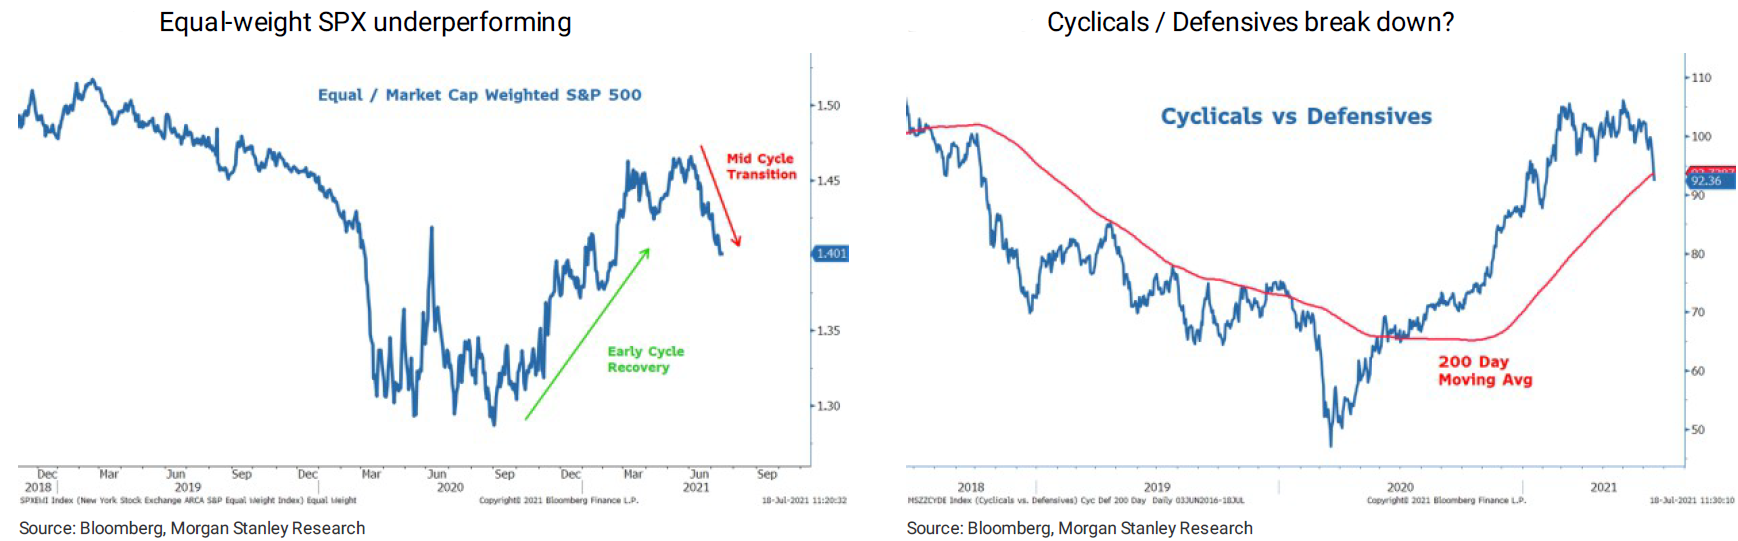
Left Chart Index: The S&P 500® Equal Weight Index (EWI) is the equal-weight version of the widely-used S&P 500. The index includes the same constituents as the capitalization weighted S&P 500, but each company in the S&P 500 EWI is allocated a fixed weight – or 0.2% of the index total at each quarterly rebalance.
Right Chart Index: Morgan Stanley Cyclical/Defensives Index is a custom index that represents an equal notional pair trade of going long high-beta cyclicals and short defensive stocks. Performance reflects each side rebalanced back to equal notional at the close of each trading day.
Source: Morgan Stanley, US Equity Strategy: Weekly Warm-Up: Time for a More “Defensive” Quality Tilt, (7/19/21)
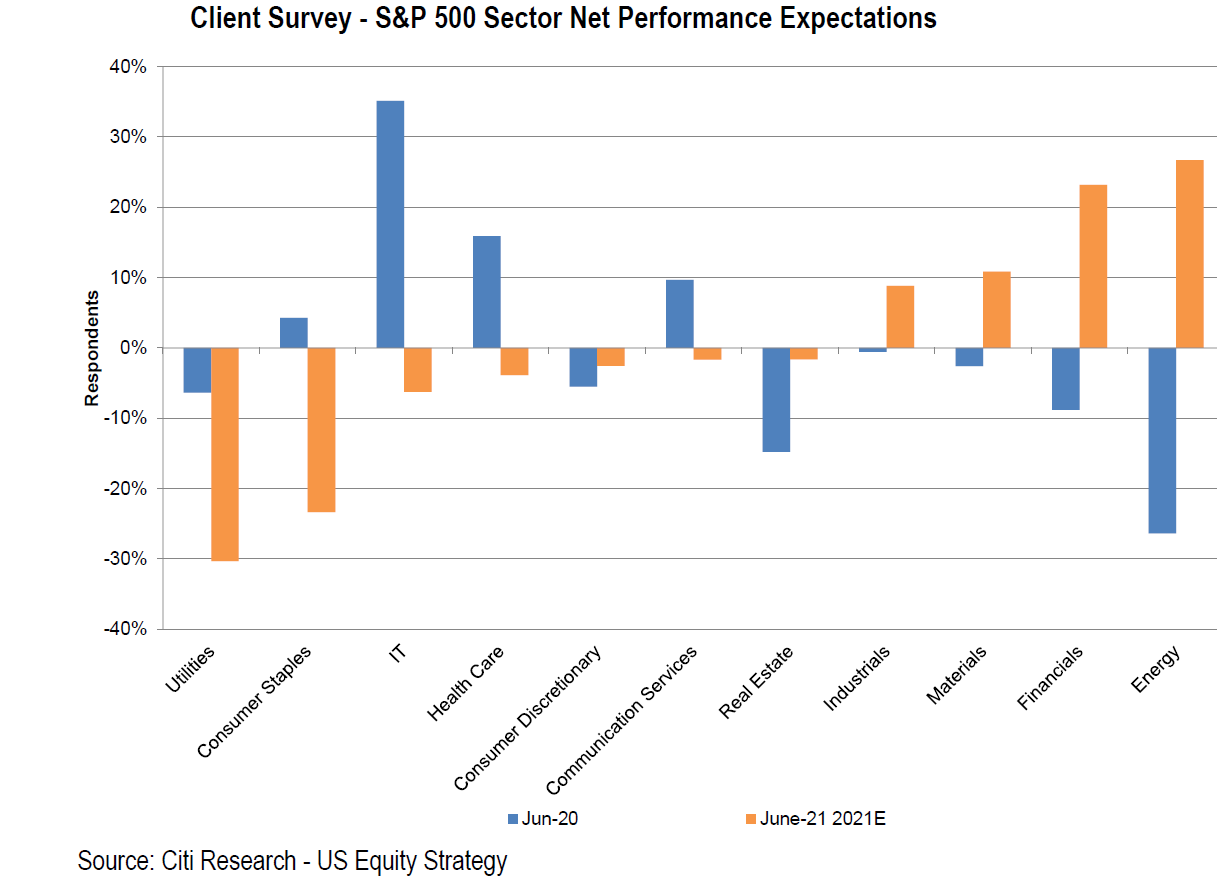
Source: Citi, Monday Morning Musings: A Summer SIGN With a Few Tweaks, (7/16/21)
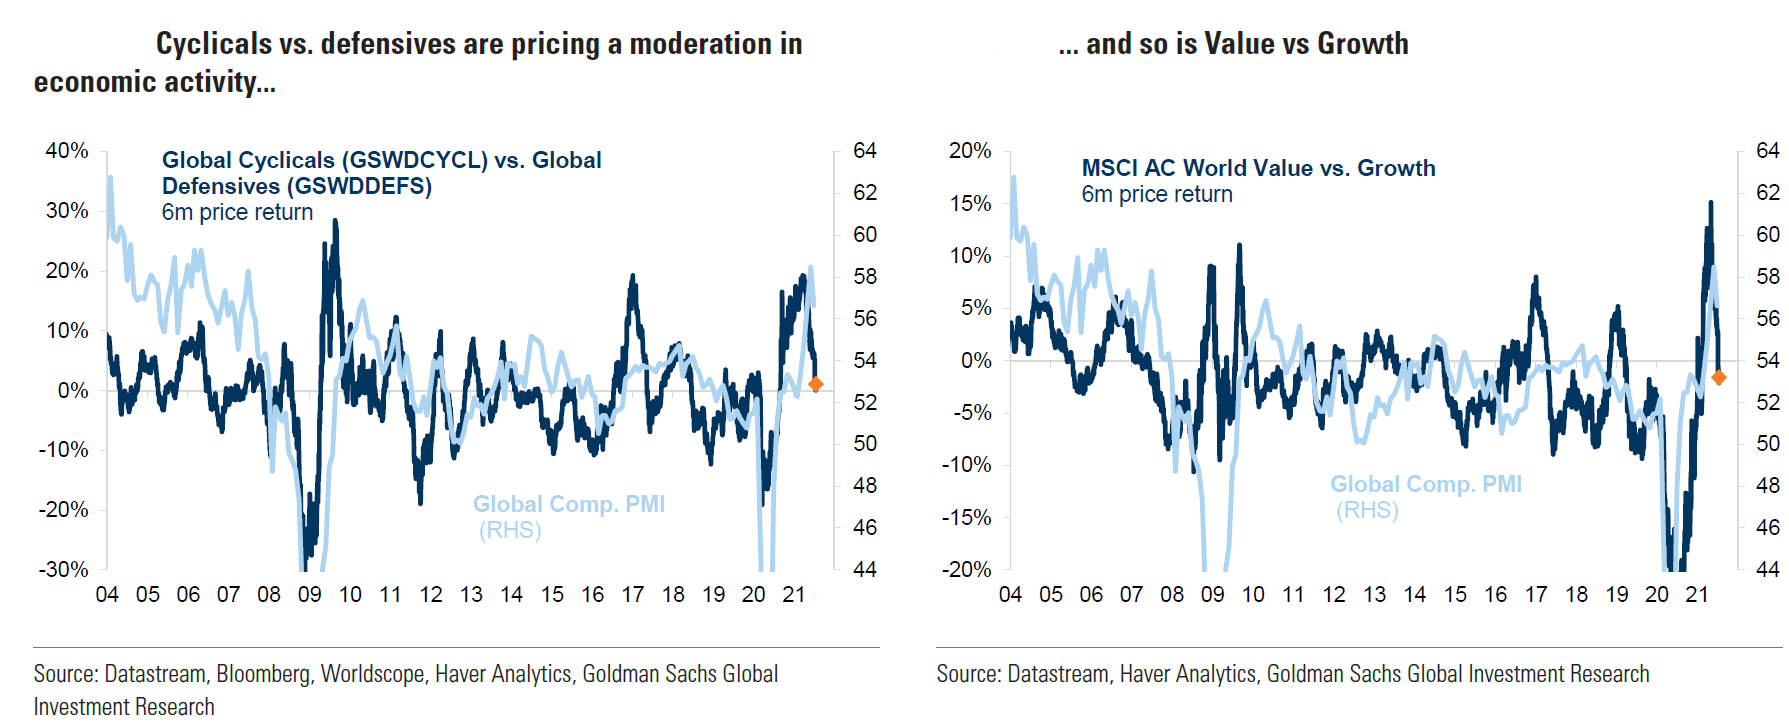
Source: Goldman Sachs, Global Strategy Views: Where to Next for the Reflation Trade? (7/19/21)
Trends in Place Before This Week
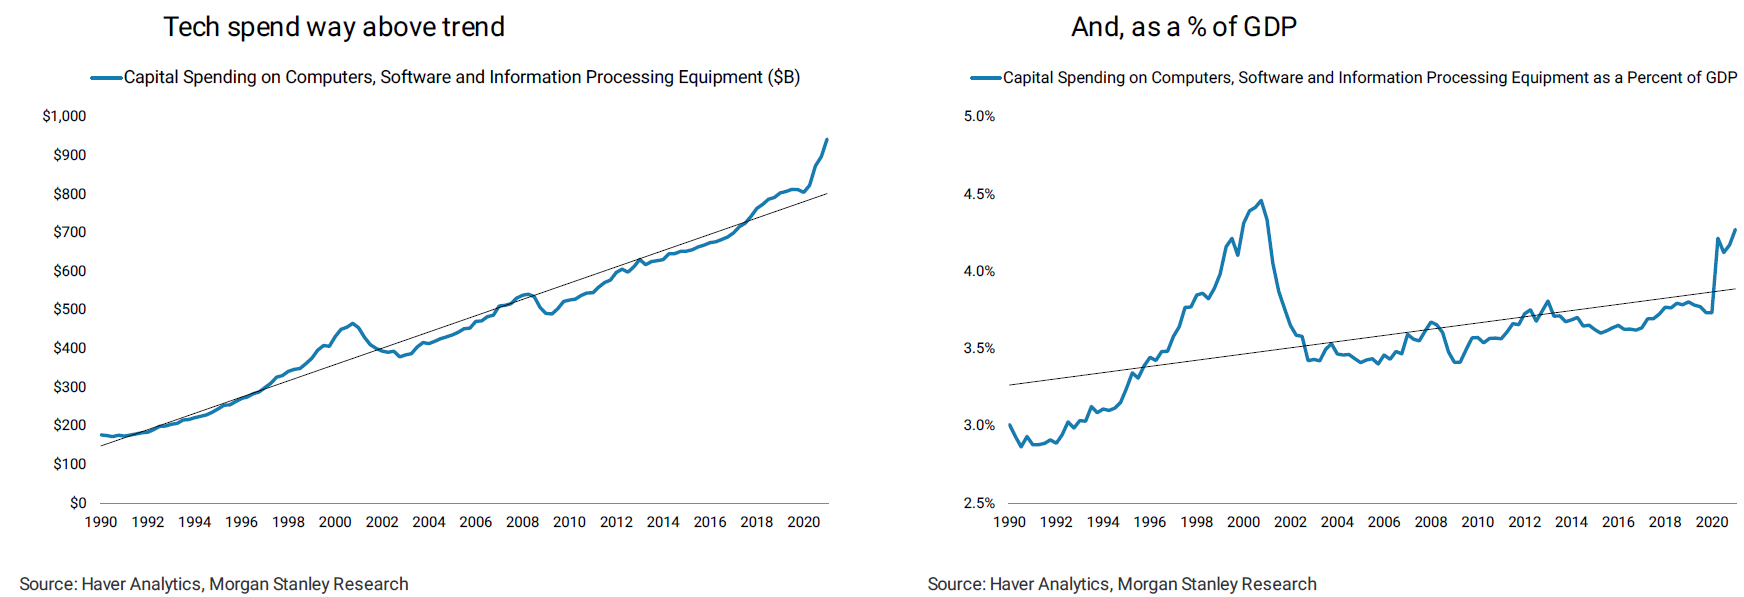
We characterize last week as a risk-off week across multiple asset classes and geographies. According to recent JP Morgan (JPM) surveys, many CEOs believed that high prices would last longer than the Federal Reserve (Fed) anticipates and the Delta variant could delay reopenings and therefore reduce economic growth in the near- and intermediate-term. Hopefully, increasing vaccination rates will dampen some of the negative effects from the Delta variant. On the other hand, the strong U.S. retail sales announced last week, actually precipitated JPM’s economic team to raise their U.S. Q3 GDP estimate. Although trading trends were rather one-sided, economic numbers were generally more positive. Geographical trends were also noted by JPM as Asian equities have underperformed global equities by 16% from their February peak. Since March, U.S. small caps and lower quality stocks have consistently underperformed the S&P 500 Index. The increasingly narrow breadth of U.S. stocks over the past month was displayed by the equal-weighted S&P 500 Index’s underperformance relative to its more recognized market cap weighted index as well as more stocks making 52-week lows versus 52-week highs over that same time frame. Fundamental trends that accompanied stock price trends included tech spending from last year way above trend as there was a “pull forward” of demand for some of their products, and disposable income had begun a downward trajectory as stimulus checks ceased. The University of Michigan survey of Consumer Sentiment released last week began to show a worrisome trend that consumers’ confidence might be slipping as their inflation expectations increased.
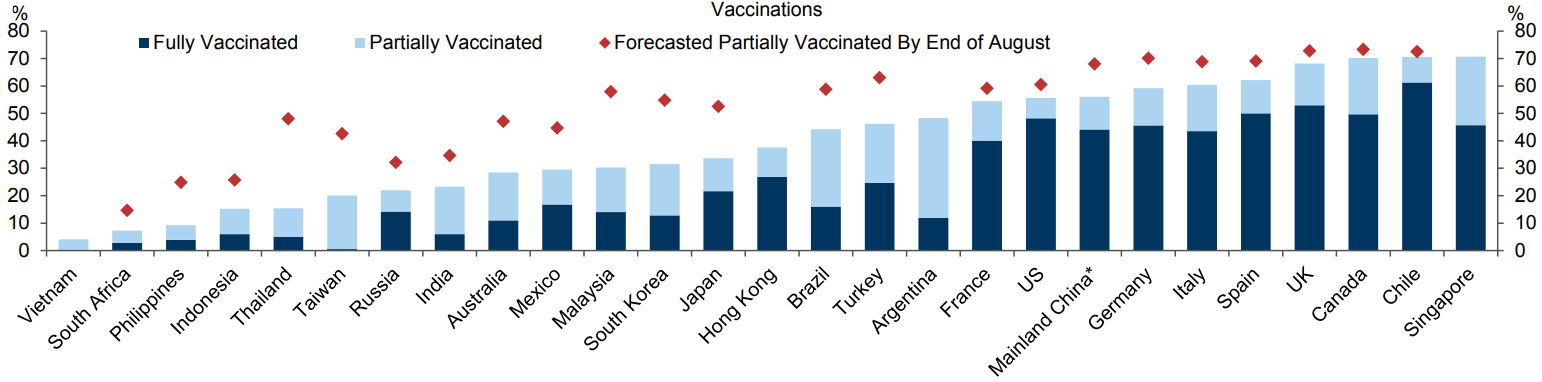
Source: Goldman Sachs, Tracking Virus and Vaccines, (7/19/21)
Some recent business sentiment surveys have indicated that U.S. peak growth may have already passed, although a Goldman Sachs economic team now forecasts that peak U.S. growth should occur in Q3. The risk-off sentiment was also exhibited by the steep drop in 10 Year Treasury yields and the rise in the VIX (measure of expectations of S&P 500 market volatility over the next 30 days) during the past 2 weeks. The recent Nonmanufacturing Philly Fed Sentiment Survey indicated that business sentiment may have even peaked months ago. Such surveys need to be carefully scrutinized, however, because business sentiment appears to be very sensitive to higher inflation expectations and the difficulty of attracting and keeping qualified employees. Sentiment shifts both for businesses and consumers have been shown to be very data dependent. We should anticipate continuing shifts in sentiment, which could lead to increases in volatility between sectors and asset classes.
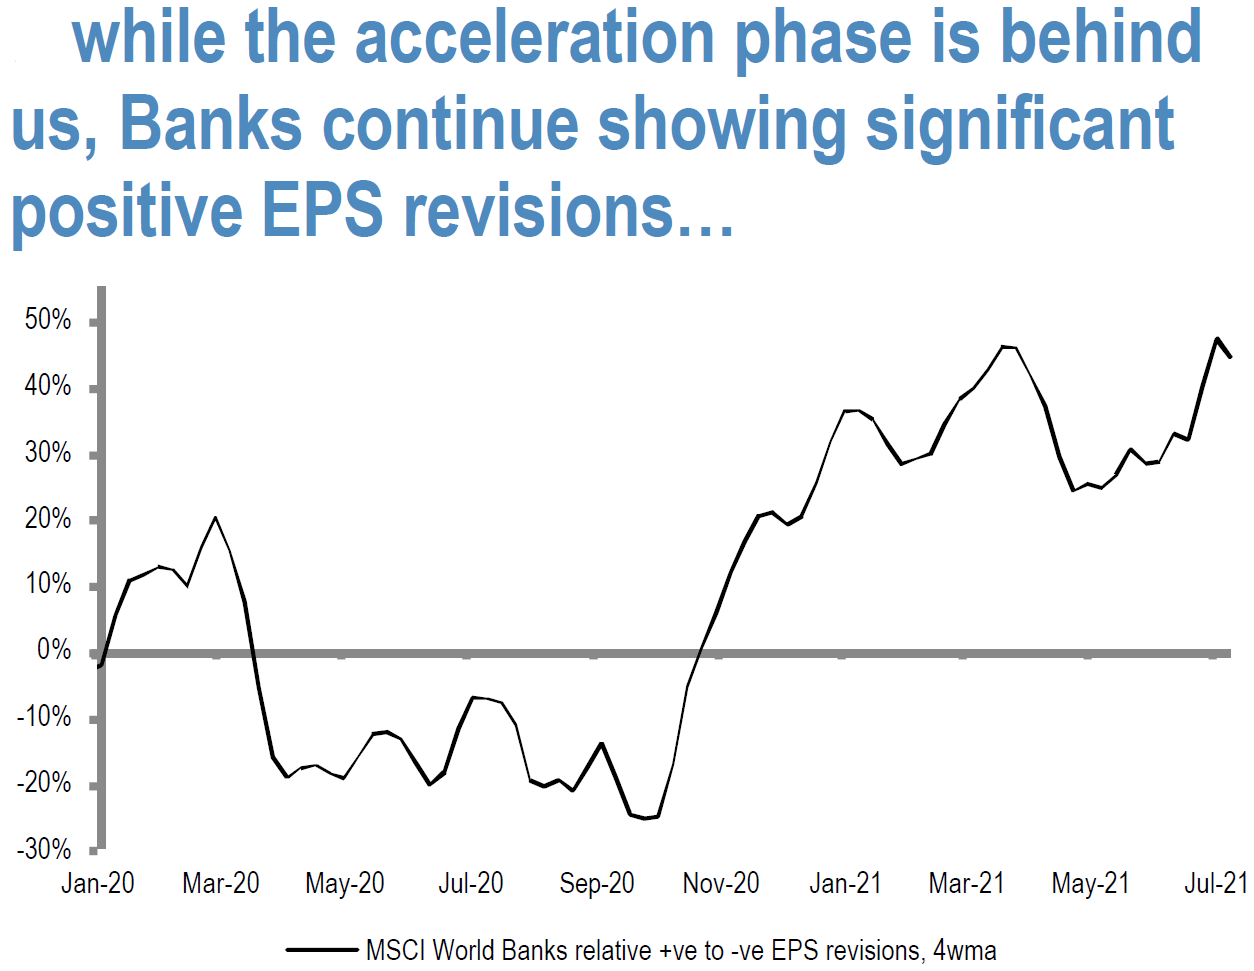
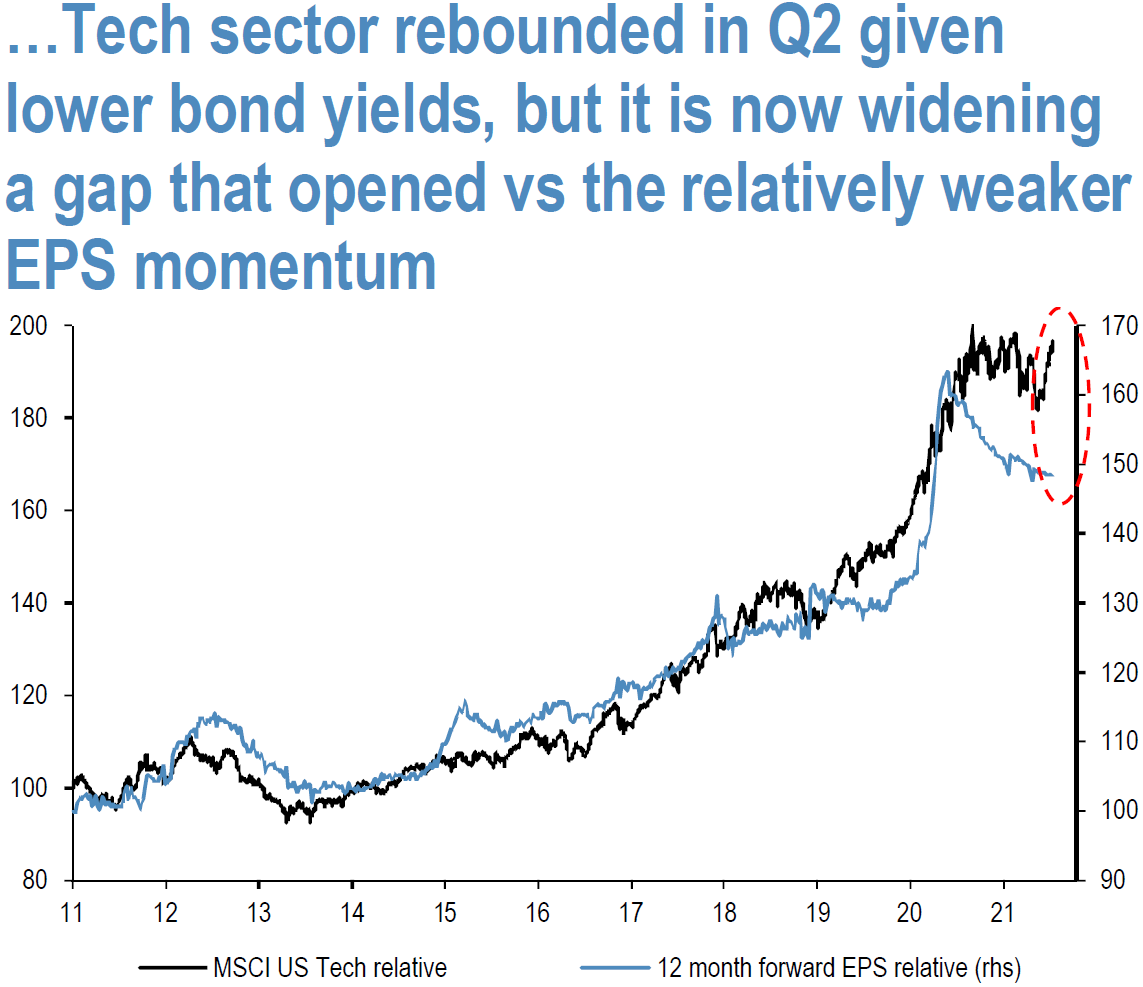
We believe that positioning against the reflation/reopening trade simply has gone too far. Sometimes exogenous factors reinforced these trends. An example of this is that U.S. pension funds took advantage of improvement in their funded status to buy more Treasuries last week, irrespective of their very low yields. Cyclical stocks had been “lagging/derating” for about the last four months. The Cyclical/Value peak has coincided with peak ISM (economic indicators) and China’s credit impulse.” Most likely, these perceived peak levels were already largely discounted by the beginning of this week. In fact, there were a few factors developing in favor of Cyclicals. JPM focused attention on the projected earnings divide between Cyclical and more defensive type stocks. Q1 estimates for Cyclicals were raised by 5%, as EPS of defensives were lowered by 6% and JPM saw the Q1 EPS trend accelerating in Q2. In the meantime, EPS revisions for banks remained positive in Q2, while Tech revisions were beginning to lose momentum.
Source: J.P. Morgan, Equity Strategy: Q2 Earnings: this reporting season potentially offers a different setup versus the last one, (7/19/21)
Mixed July PMIs for U.S. and Eurozone
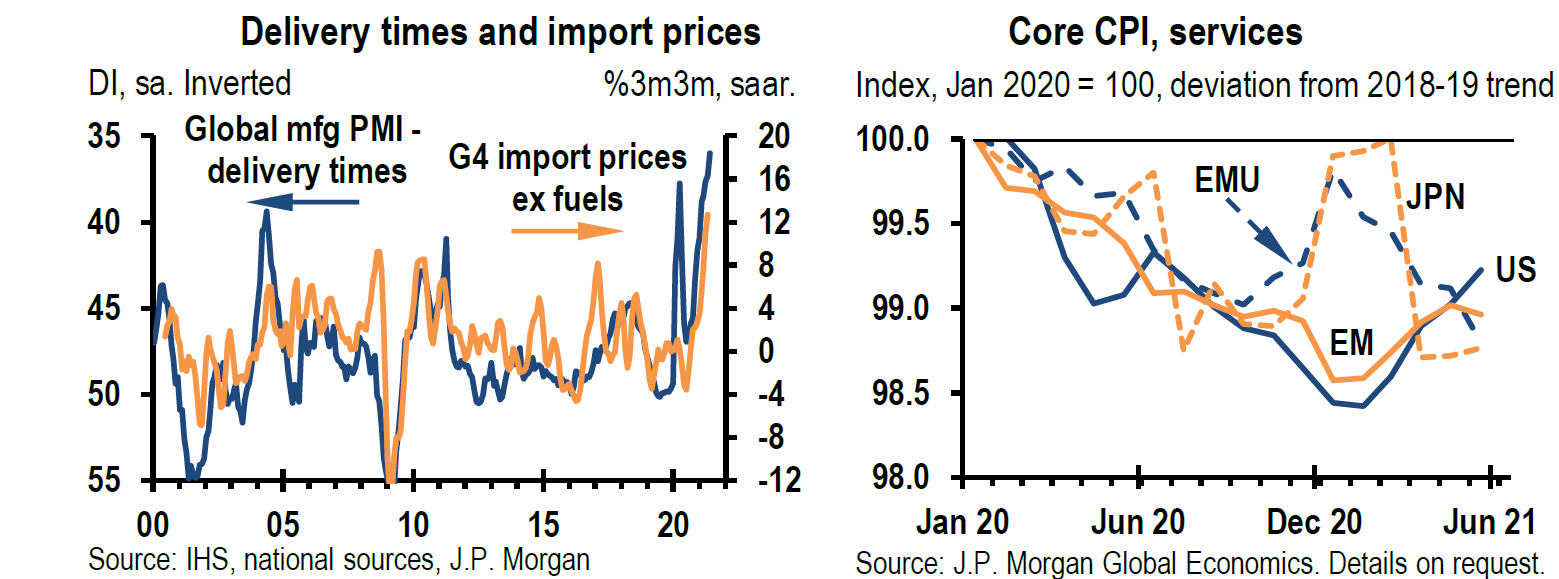
Although the details might differ for July’s PMIs (generally considered a reliable indicator of GDP growth), the message remains the same: prices continue higher and when economic growth and/or activity disappoints, it is almost always tied to supply chain disruptions, hard to get supplies or labor shortages. The IHS Markit U.S. Manufacturing PMI exceeded expectations and hit another record high in July. Production rose despite reports of materials shortages as the pace of new orders quickened, including a noted stronger uptick in foreign client demand. Lead times lengthened along with supply chain disruptions. Input costs and the rate of charge inflation each rose at a record pace. In contrast, U.S. Services PMIs were lower when compared to the previous month and were below expectations, with new business rising at the slowest pace in 5 months. Business confidence also fell to a 5-month low. In addition to noted labor shortages, some firms detected customer hesitancy due to significant increases in selling prices. Both input costs and output charges continued to rise at a strong rate. Unlike the U.S., the Eurozone Manufacturing PMIs only slightly exceeded expectations but were lower from June, while Its Services PMIs exceeded expectations as it reached a 181-month high in July. According to IHS Markit on July 23, the “strongest rise in service sector activity for 15 years was tempered … by a slowing in manufacturing output growth, linked in many ways to worsening supply lines.” Prices charged for both goods and services rose at near record levels. Like the U.S., Eurozone business confidence also hit a 5-month low, but was due mostly to concerns over the Delta variant. Overall, Eurozone growth was the fastest for 21 years.
How far along a country is with respect to its reopening and “mobility” trends matter. Other idiosyncrasies matter as well. The U.S. is further along than the Eurozone in its reopening and at this point the services sector is finding it more difficult to attract needed workers. The U.S. unemployment rate was much higher at the peak of the pandemic relative to Europe. Labor shortages in Europe are not nearly as acute as in the U.S. The more recent removal of travel restrictions in Europe also contributed to services sector growth in July. Given these factors, it is not surprising that the Eurozone Services growth rate would be accelerating now. IHS Markit also observed that although Eurozone manufacturing growth continues to expand, it was at the lowest rate since February. German output was constrained by input shortages and supply chain delays. In fact, the length of such delays was accelerating at some of the fastest rates ever recorded by Eurozone PMI surveys. Perhaps Eurozone manufacturers’ difficulties helped boost the U.S. Manufacturing PMI numbers as there was more foreign demand for U.S. goods. This is yet another example of the continuing uneven effects worldwide which can be mostly attributed to the pandemic. We interpret this economic activity and inflation data to be very supportive of our view that Value and Cyclical stocks will outperform at some point. But once again the market appears to ignore such data as defensive and growth stocks outperform on the day of the release of this information.
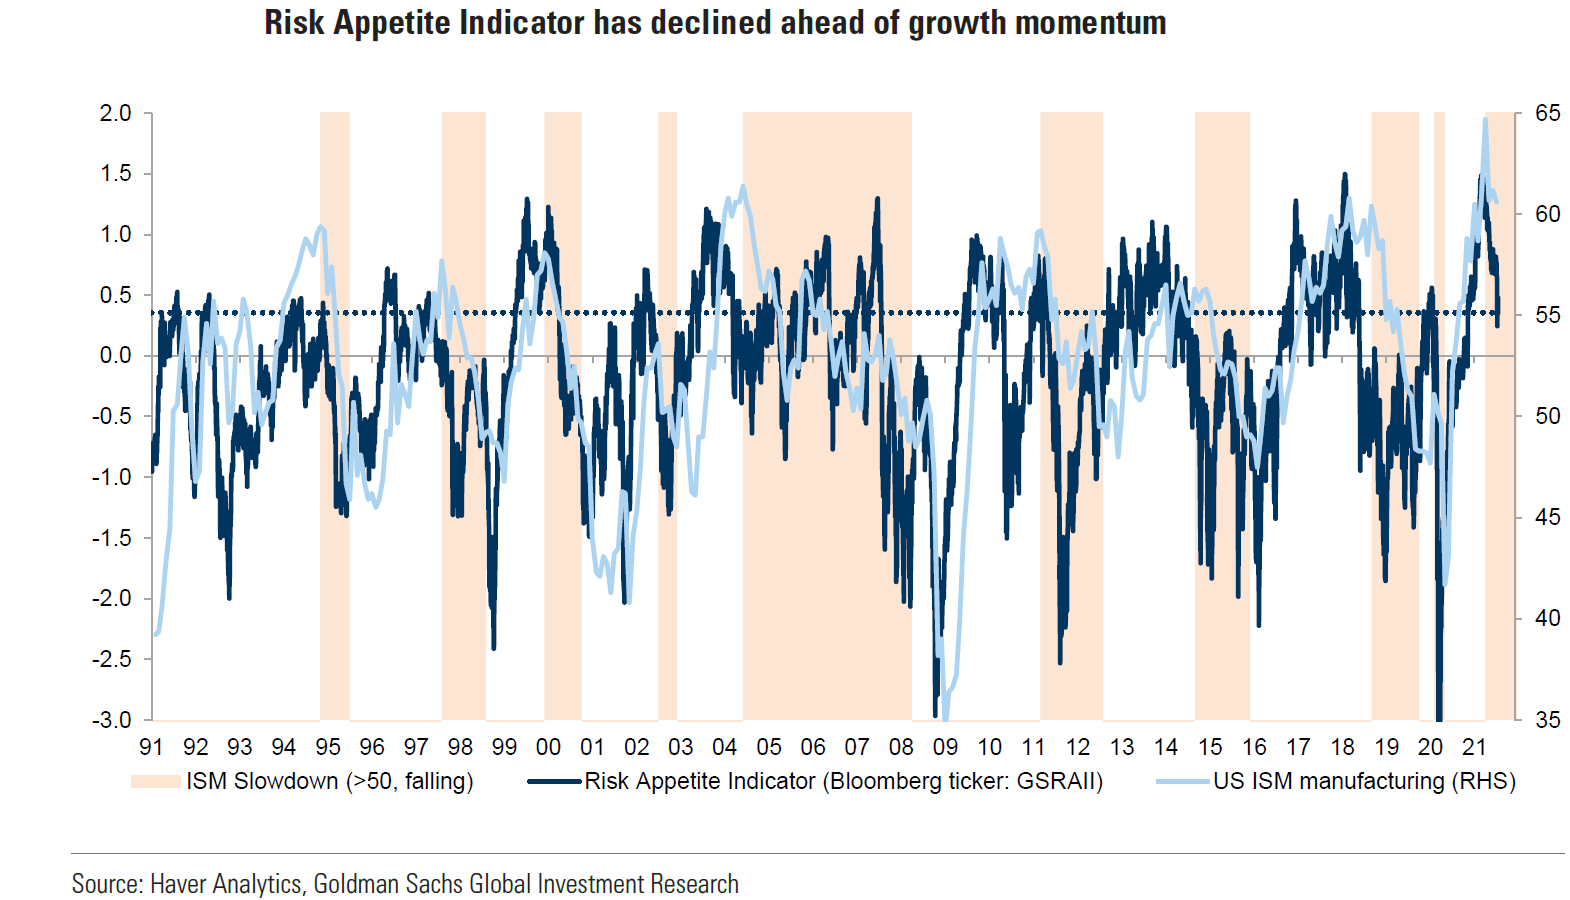
Risk Appetite and Volatility
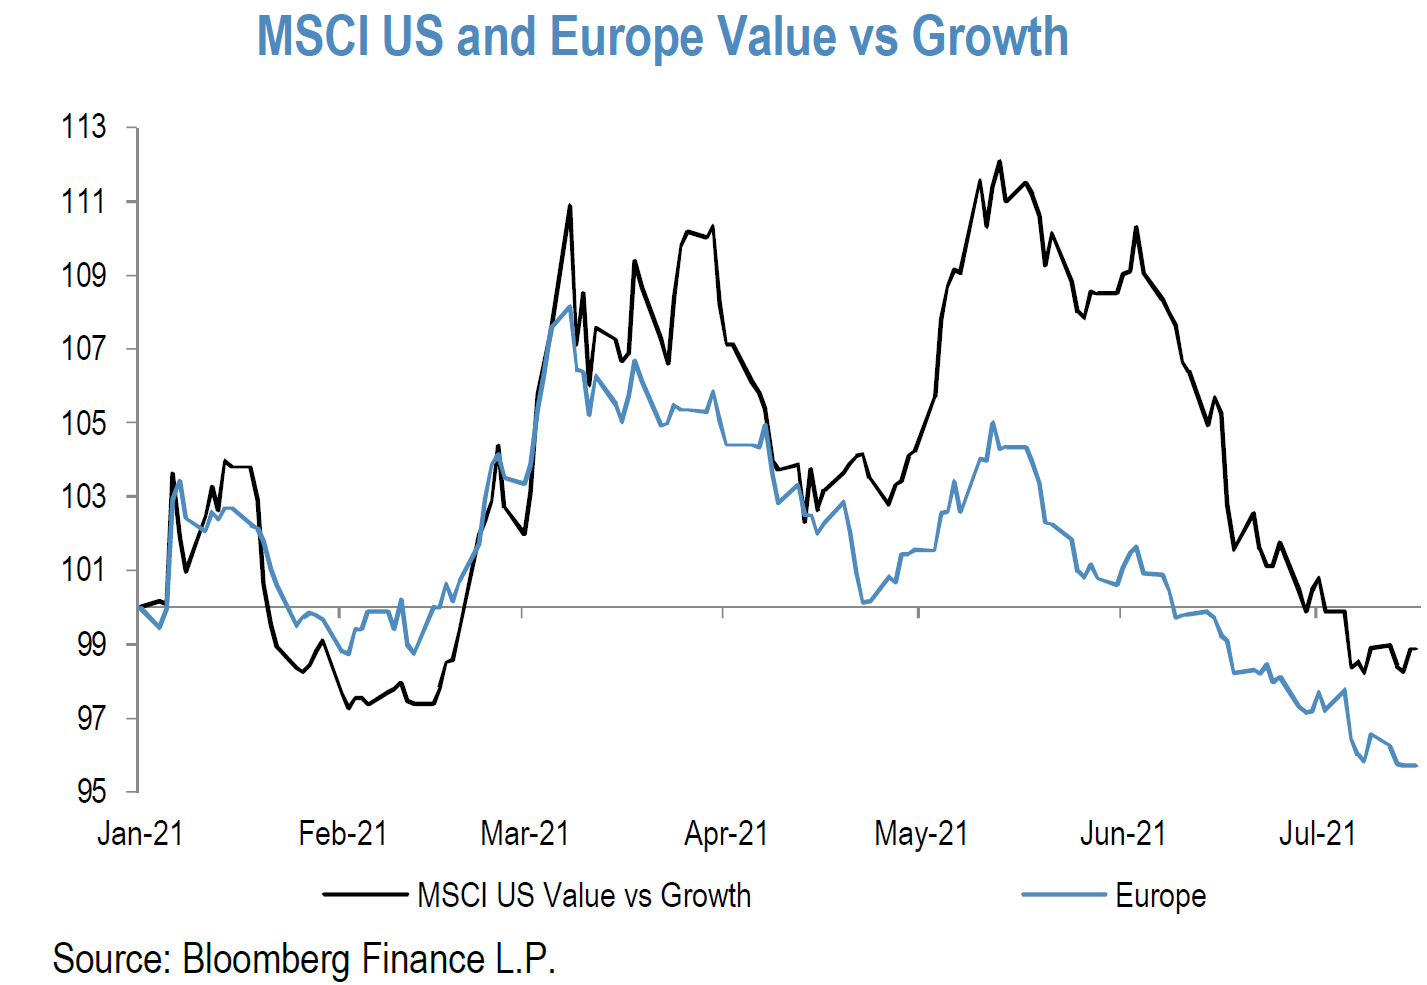
In its July 19 GOAL Kickstart report, Goldman Sachs highlighted that its “Risk Appetite Indicator” (RAI) declined ahead of a slowdown in growth momentum as indicated by U.S. manufacturing ISM data. This was accompanied by a slight retracement of longer-term inflation expectations, as shorter-term inflation expectations continued their ascent. The rotation out of reflation trades continued last week as concerns grew over the perceived likelihood of economic slowdowns. The VIX perhaps provided a good indication of how quickly these concerns can accelerate very quickly. At the beginning of July, the VIX was at a post-pandemic low of about 15 before rising to roughly 16 in the middle of last week, but finished last week over 18. It reached a peak of about 24 on Monday before receding to roughly 17 at the end of this week Realized volatility and the decrease in RAI was even more pronounced in Europe, as more Value and Cyclical type stocks are more prevalent in most EU stock indexes. Goldman believes that a VIX of about 16 is a more appropriate level given the currently available macro data. Although Goldman remains pro-risk for 2H, they would be more selective and balanced in their pro-cyclical exposures. We concur with this view.
Source: Goldman Sachs, Global Strategy Views: Where to Next for the Reflation Trade? (7/19/21)
Frequent Sector Rotations
We continue to expect sector rotations, but at a more frequent rate. There seem to be an increasing deluge of factors that have weighed on investor expectations. These factors included a flattening of the 2-10 Year Treasury yield spread by over 40 bps since the beginning of April, the slightly moderating long-term inflation expectations even as short-term expectations continue to rise, Delta variant concerns, the surprise Chinese cut in the reserve requirements of their banks leading to speculation that the China’s economy was slowing more than expected, and perceived peaking of GDP growth rates. We believe that a sharp slowdown was already priced in at Monday’s lows and that the rotation back to defensives and growth stocks had gone too far. We continue to believe that economic growth will benefit from strong job growth and wage gains, a positive inventory cycle, a more localized supply chain at the margin – which could lead to higher economic growth along with higher prices – and further growth from reopenings in spite of the Delta variant. The movement to de-carbonization and away from fossil fuels should eventually lead to more CapEx and economic growth. It could eventually support and even propel Energy prices higher. The extreme decrease in the 10 Year Treasury yield is yet another indication that rotation away from Cyclicals and Value stocks had gone too far. The 10 Year Treasury yield traded as low as 1.12% intraday this week. It decreased by 10 bps on Monday alone to close at 1.19%. According to Citi Research on July 20, at a level of 1.19%, the 10 Year yield was actually closer to the November 2020 pre-vaccine breakthrough level of 0.82% (37 bps gap) versus the March reflation high of 1.74% (54 bps gap).
Source: J.P. Morgan, Global Asset Allocation: Position for a Resumption of the Reopening/Reflation Trade, (7/14/21)
Source: J.P. Morgan, US Weekly Prospects, (7/16/21)
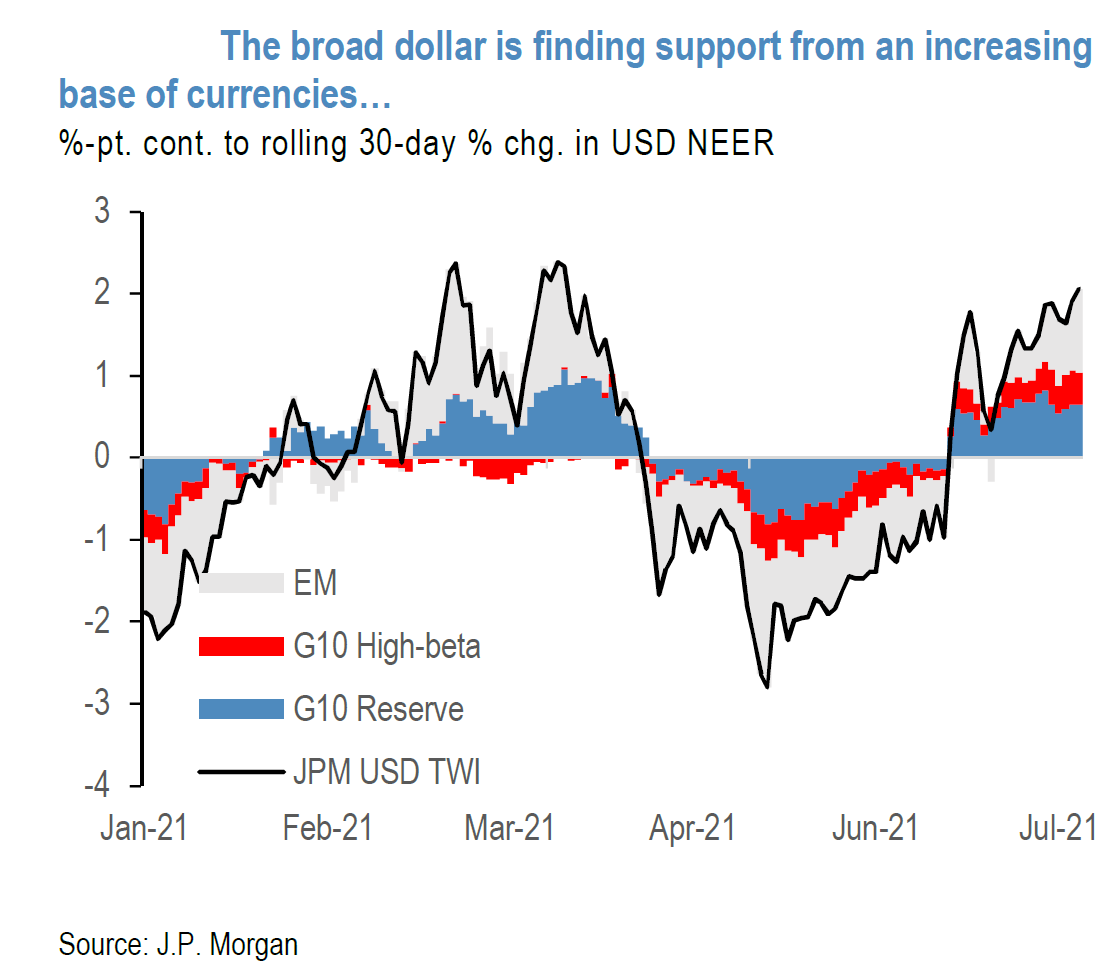
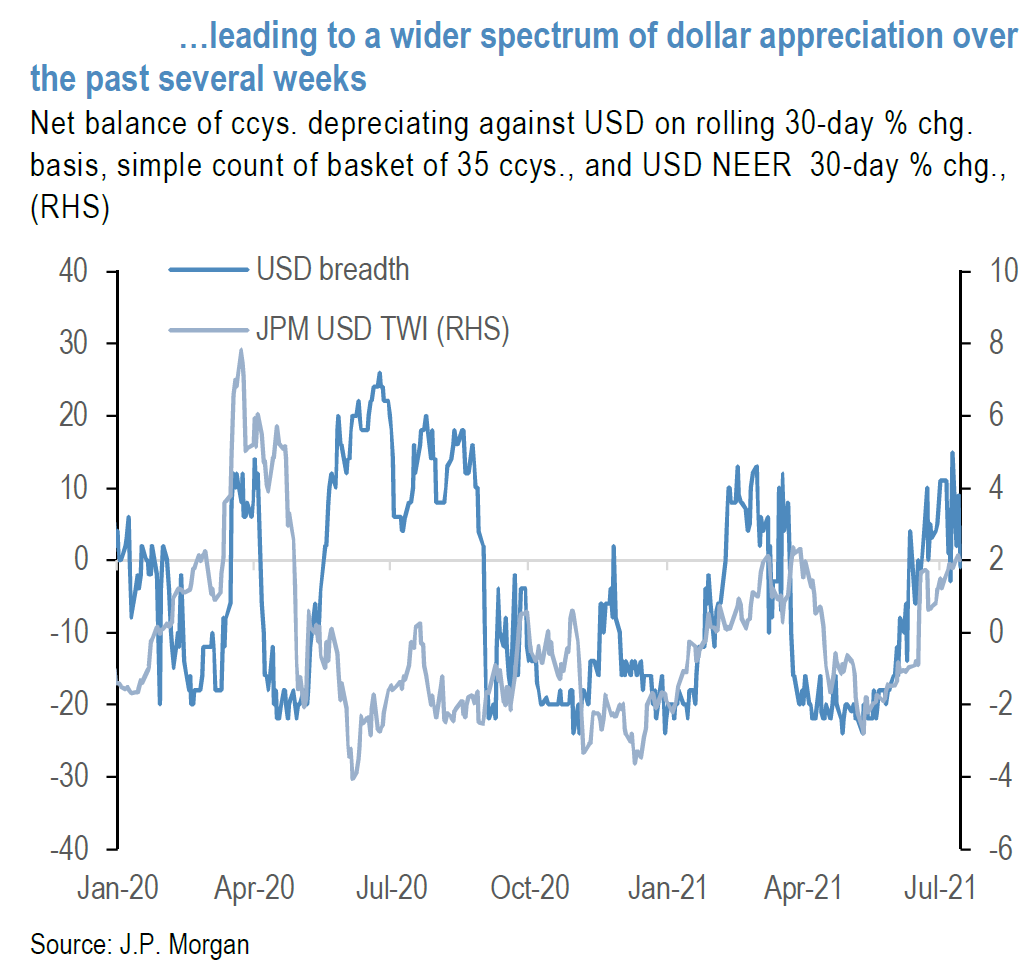
USD and Foreign Exposure
We believe that the recent strength of USD has been somewhat correlated to a shift away from Cyclicals and Value stocks. The economies of most other countries are tilted towards Cyclicals in contrast to the more services-focused U.S. economy. The U.S. has further benefited from its leadership position in reopenings, which mostly benefit the services sectors. If the rotation back to more Value and Cyclical stocks can continue this might eventually lead to a weaker USD. The USD might also eventually weaken to the extent that the Delta variant does not greatly delay reopenings in other countries. USD weakness would obviously benefit foreign companies, as well as U.S.-based companies with a large percentage of their earnings generated abroad. We have been recommending such exposure in part so as to benefit from the rolling global economic recovery. We continue with those recommendations. According to a FactSet July 16 report, the Q2 earnings of U.S. companies with over 50% foreign sales are expected to grow by 87.0% y/y versus. 62.0% expected for companies with over 50% U.S.-generated sales. Excluding Exxon (65% revenues outside U.S.) and Chevron (61%), the 87.0% figure drops to 63.9%. Sales growth for U.S.-focused companies is forecast to grow by 17% y/y versus those U.S. companies with over 50% foreign revenues, which are expected to grow by 30.5% y/y in Q2. Again, excluding Exxon and Chevron, this latter growth rate drops to 24.5%. The energy sector is expected to be the biggest contributor to earnings and sales growth rates for any S&P companies with more international exposure in Q2.
Source: J.P. Morgan, FX Markets Weekly: USD Still Benefiting from Tailwinds, (7/16/21)
Bottom Line
We expect even more frequent sector rotations going forward and more price volatility across asset classes. We would continue to be opportunistic in adding to Cyclicals and Value stocks on any significant downdrafts. We see no need to chase anything at this juncture. As we highlighted in last week’s letter, there appears to be an increasing dispersion of inflation expectations even as median inflation expectations rise. Dispersions of opinions appear to be increasing, as well, with respect to economic growth rates, sector and asset preferences and the Delta variant’s effect on reopenings and economic growth rates. We believe that the Delta variant could delay reopenings and slow – but not derail – global economic growth. We believe that interest rates are still too low relative to our understanding of underlying economic “fundamentals.”
Because of the shallow nature of many investors’ conviction levels as to their economic and market outlooks, in addition to the dispersion of such views, almost every new data point has the potential to affect market prices and outlooks.
Perhaps the greatest risk to the equity markets in particular is that the Delta variant could lead to an unexpected increase in supply and labor disruptions. Such disruptions have the potential to slow economic growth while increasing inflation depending on where they occurred. Stagflation worries could then become an increasing concern. These are the type of factors that can cause market dislocations. Other potential market moving developments include a deterioration of U.S./China relations, the outcome and timing of Iran nuclear discussions and their effect on oil supplies, and President Biden administration’s efforts to develop a more robust antitrust enforcement framework. China’s increased scrutiny and oversight of its largest tech companies could also have unexpected ramifications. Carpe Diem is the appropriate investment stance when presented with attractive entry points.
Index Definitions:
VIX: The VIX Index is a calculation designed to produce a measure of constant, 30-day expected volatility of the U.S. stock market, derived from real-time, mid-quote prices of S&P 500® Index (SPX℠) call and put options.
Russell 1000 Value: The Russell 1000 Value Index measures the performance of the large-cap value segment of the U.S. equity universe. It includes those Russell 1000 companies with lower price-to-book ratios and lower expected and historical growth rates.
Russell 1000 Growth: The Russell 1000 Growth Index measures the performance of the large-cap growth segment of the U.S. equity universe. It includes those Russell 1000 companies with higher price-to-book ratios and higher forecasted and historical growth values.
NASDAQ: The Nasdaq Composite Index is the market capitalization-weighted index of over 2,500 common equities listed on the Nasdaq stock exchange.
S&P 500: The S&P 500 Index, or the Standard & Poor’s 500 Index, is a market-capitalization-weighted index of the 500 largest publicly-traded companies in the U.S.
MSCI EM Value Index: The MSCI Emerging Markets Value Index captures large and mid cap securities exhibiting overall value style characteristics across 27 Emerging Markets (EM) countries
MSCI EM Index: The MSCI Emerging Markets Index captures large and mid cap representation across 27 Emerging Markets (EM) countries
KBW Nasdaq Bank Index (BKX): The KBW Bank Index is designed to track the performance of the leading banks and thrifts that are publicly-traded in the U.S. The Index includes 24 banking stocks representing the large U.S. national money centers, regional banks and thrift institutions
IMPORTANT DISCLOSURES
The views and opinions included in these materials belong to their author and do not necessarily reflect the views and opinions of NewEdge Capital Group, LLC.
This information is general in nature and has been prepared solely for informational and educational purposes and does not constitute an offer or a recommendation to buy or sell any particular security or to adopt any specific investment strategy.
NewEdge and its affiliates do not render advice on legal, tax and/or tax accounting matters. You should consult your personal tax and/or legal advisor to learn about any potential tax or other implications that may result from acting on a particular recommendation.
The trademarks and service marks contained herein are the property of their respective owners. Unless otherwise specifically indicated, all information with respect to any third party not affiliated with NewEdge has been provided by, and is the sole responsibility of, such third party and has not been independently verified by NewEdge, its affiliates or any other independent third party. No representation is given with respect to its accuracy or completeness, and such information and opinions may change without notice.
Investing involves risk, including possible loss of principal. Past performance is no guarantee of future results.
Any forward-looking statements or forecasts are based on assumptions and actual results are expected to vary from any such statements or forecasts. No assurance can be given that investment objectives or target returns will be achieved. Future returns may be higher or lower than the estimates presented herein.
An investment cannot be made directly in an index. Indices are unmanaged and have no fees or expenses. You can obtain information about many indices online at a variety of sources including: https://www.sec.gov/fast-answers/answersindiceshtm.html or http://www.nasdaq.com/reference/index-descriptions.aspx.
All data is subject to change without notice.
© 2021 NewEdge Capital Group, LLC


