Press the steps I take to cross your door frame
“Crossing the Frame” – Coheed and Cambria
As U.S. large cap indices “crossed the frame” of prior highs to trade near or to new all-time-highs, it is helpful to take an assessment of the tailwinds and headwinds for equity returns from this point (instead of “casting quarters into wells that hold our dreams”).
The following table outlines these potential tailwinds and headwinds for U.S. equities in the coming months.
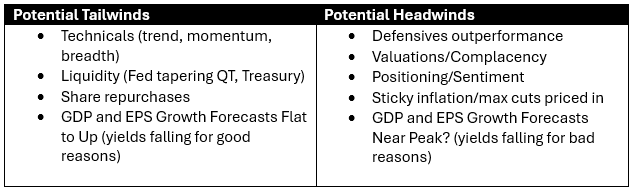
Overall, we see this market as potentially supported by the tailwinds of technicals (momentum, breadth, trend), liquidity, rising EPS estimates (helped by share repurchases), and stable GDP estimates. This market is not without its headwinds, but these likely need a catalyst to begin to bite, such as continued weaker economic data that sparks GDP estimate cuts. We can take cues from factors like the outperformance of defensive sectors about the probability of this catalyst occurring, with these signals near flashing “yellow lights”. Factors like positioning, sentiment, and valuation rarely cause market volatility themselves, but they can add to potential volatility as they unwind from elevated/extreme levels.
In the sections below, we dive into a handful of these factors to help us weigh the potential paths for equities in coming months.
“Give Me All You Got”: U.S. GDP and EPS Estimates
We’ll start in reverse order of listing, but first order of importance. The last bullet in each bucket, GDP and EPS estimates, remains the biggest swing factor for risk asset performance and risk appetite.
As we detailed in a recent Weekly Edge, rising growth forecasts have underpinned this risk asset rally for the last 18 months, allowing markets to shake off concerns about stickier inflation, higher yields, a tighter Fed, and a whole host of “exogenous” shocks (like geopolitical events). This support from growth makes tracking future changes to growth forecasts an imperative.
After 2024 GDP estimates have been revised higher by nearly 200 bps to 2.4% over the last 9 months, we see 2024 GDP growth estimate revisions near their peak, though not immediately destined for sharp revisions lower, given a still-tight labor market, and fulsome fiscal spending.
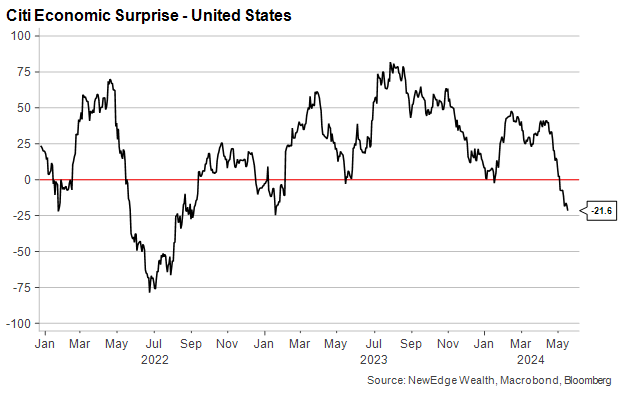
Though we are not making a call for large revisions lower at this time, we are on watch for items that could challenge the consensus ever-higher growth narrative. Last week, we detailed the message from PMIs that have been moderating, not strengthening, and this week we received weaker growth data from the U.S. consumer, with retail sales coming in well below expectations (the Control Group was -0.3% vs. consensus for +0.1% and the prior month of +1.0%).
This weaker data led to further downside for the Citi Economic Surprise Index, a measure of how economic data is coming in versus forecasts. This index is now at its lowest level since 2022, a time when future GDP and EPS forecasts were getting cut.
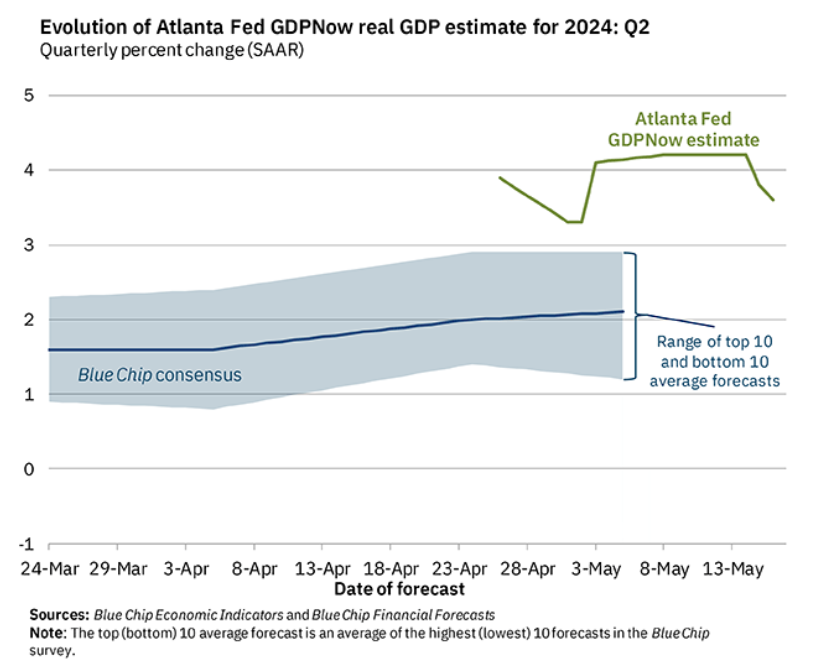
This downside surprise to retail sales also contributed to a revision lower for Atlanta Fed GDPNow forecast for 2Q24 growth. It should be noted that even with this revision lower, this nowcast forecast of 2Q24 GDP growth is still above the “Blue Chip” consensus of 2% and the Bloomberg consensus of 3% growth for the quarter.
All in, we see GDP growth estimates nearing a peak, but are not calling for estimate revisions lower yet, hence including this factor as both a tailwind (if growth estimates remain resilient) and a headwind (if recent weaker data begins to eat away at growth estimates).
Putting this into context for equities, the chart below shows how the 12-month forward EPS forecast for the S&P 500 continues to make new all-time highs, a clear support for equity markets (though note this measure tends to lag; in 2022, 12-month forward EPS didn’t peak until May, well after the start of the bear market and GDP estimates cuts).
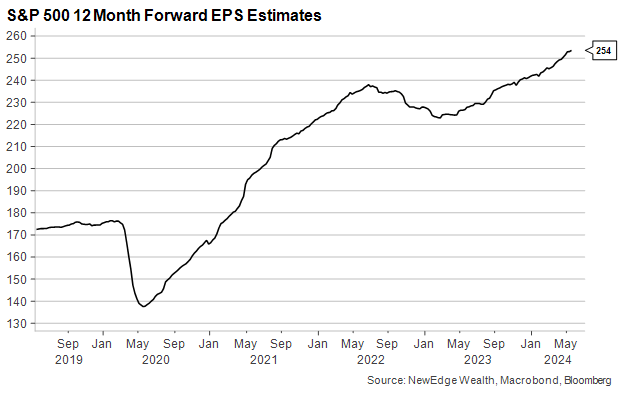
Of course, this measure benefits from time: as the calendar year progresses, more of the next year’s earnings growth is included in the 12 month forward number. As we outlined in the Weekly Edge on growth, 2025 EPS estimates do make aggressive margin expansion assumptions to achieve the forecasted $275, which may or may not materialize.
As we inch towards 2025, we will have to judge the reasonableness of these forecasts to assess the risk/opportunity of estimate revisions lower/higher (one item that is helping to fuel EPS increases is buybacks, which recently hit their highest level since 2018, according to Deutsche Bank data via Yahoo Finance).

“But I Wish That You Were”: Inflation Stickiness and Fed Pricing
One of the most important observations over the last 18 months is that the Fed has not really mattered for the performance of equities or credit.
Equity markets were able to continue to rally, and credit spreads were able to continue to tighten even as expectations for the Fed swung wildly from hawkishness (in the fall of 2023) to aggressive dovishness (January 2024 when 6.5 cuts were priced in for the year), and then back to hawkishness in recent months as inflation proved stickier than hoped.
As shown in the section above, we think the key reason for the equity market’s ability to barrel on, despite these swings in Fed expectations, is because growth expectations have remained so resilient.
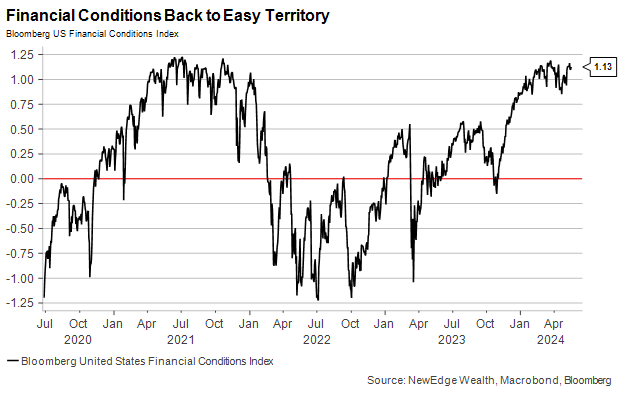
Even though the inflation/Fed factor has been far less important for equity returns than growth expectations, we should not ignore this factor completely, as it could be a source of near-term volatility in both equity and fixed income. Further, inflation driven Fed expectations could even lead to changes in GDP/EPS forecasts if analysts were to see Fed policy as truly restrictive (it’s hard to agree with assertions that policy has been “sufficiently restrictive” given financial conditions are at 2021 easy levels and economic growth has been above trend for nearly a year).
On inflation, April’s in-line and moderating CPI data was a welcome relief from the hotter-than-expected prints to start the year, though it remained sticky and elevated well above the Fed’s 2% target.

We think the interpretation of this data is that it removes the risk of further rate hikes (for now) but is not cool enough to open the door for a swift pivot to cutting rates this summer. The market appears to agree, with the first full cut priced in for November and a total of 1.8 cuts forecasted for 2024.

It remains to be seen if sticky inflation and the further pushing out of expected cuts will result in future equity volatility (as Barry Bannister of Stifel argues in his case for a 10% equity correction over the summer). So far in 2024, a tighter Fed has not derailed equities, but as we continue to note, this is likely thanks to the backdrop of rising growth forecasts.
“From Fear Through the Eyes of Madness”: Positioning and Sentiment
As we wrote at the end of 2023, positioning and sentiment are important drivers of medium-term equity returns.
At that time, we noted that sentiment and positioning were “stretched but not extreme”, suggesting more room for these measures to get extended (as the market rallied) before becoming an impediment to near term returns.
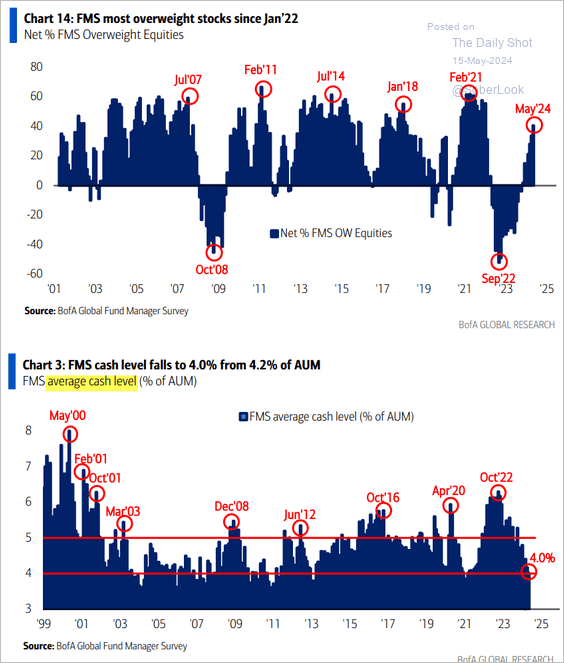
Today, we have a similar assessment, where sentiment and positioning measures look more stretched than they were to start the year, but still not at prior extreme peaks (like in early 2018 or late 2021/early2022).
The following two charts show this positioning and sentiment dynamic for institutional investors, which now have their highest equity allocations and lowest cash allocations since 2021, but not at extremes.
Bank of America Fund Manager Survey
Goldman Sachs Institutional Sentiment Indicator
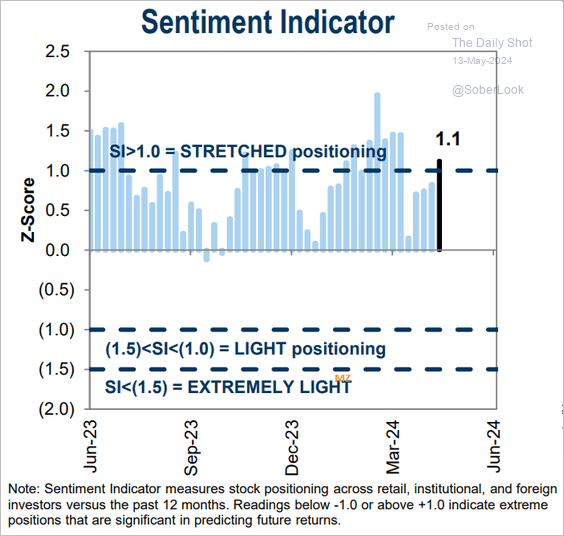
The next chart shows positioning and sentiment for individual investors, whose allocations sit at ~69%, shy of the 71% peaks in 2018 and 2022, while sentiment just coming off highs not seen since 2021.
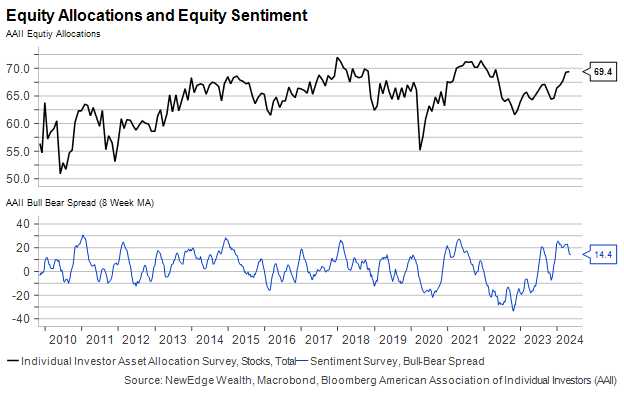
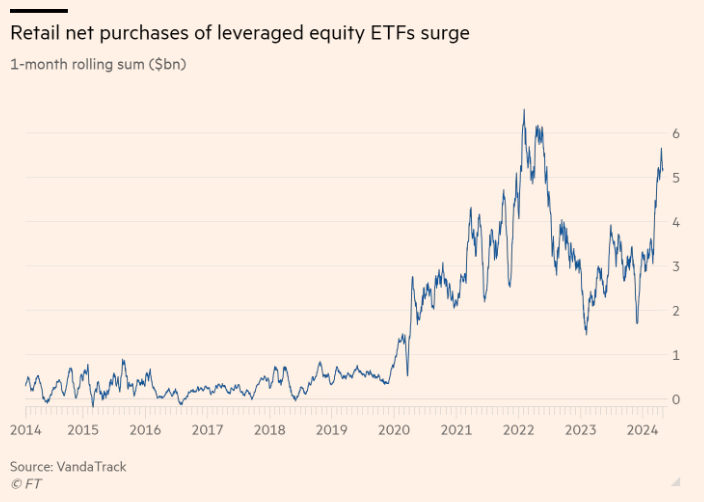
There is clearly still ample appetite for risk and liquidity to fund risk-taking behavior, as we saw with the meme-stock surge this week, a VIX below 13, a surge in retail buying of leveraged ETFs, and more.
“I Left in a Sudden Rush”: Technicals and Defensives Outperformance
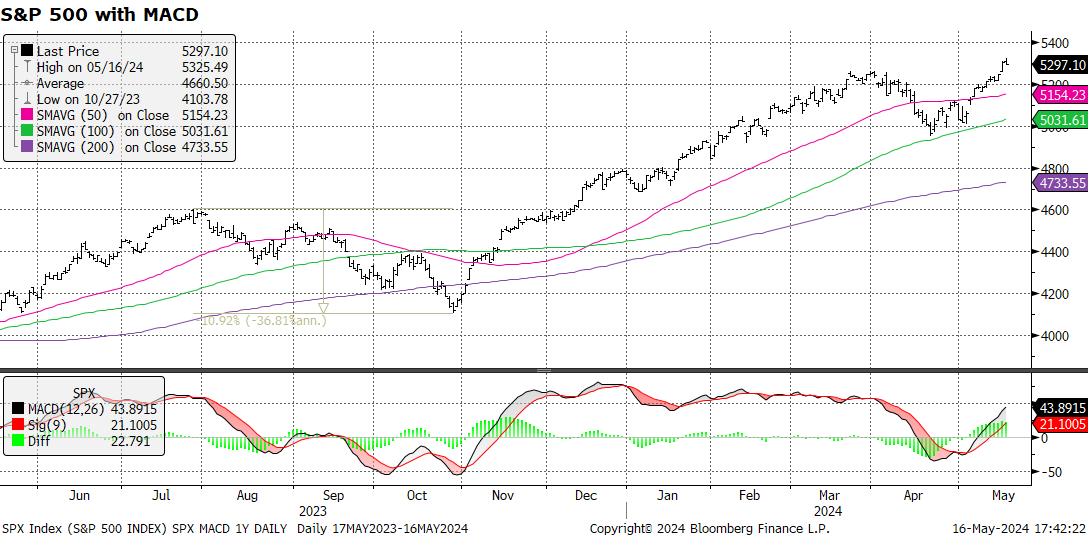
“Respect the momentum” is a phrase we utter often, as a good reminder that price action is more important than the narratives or stories we can tell about markets.
Today’s market has momentum on a short-term basis, using measures like the Moving Average Convergence Divergence shown below, while it also is not quite overbought yet, using measures like the Relative Strength Index.
We continue to pay close attention to the performance of cyclicals vs. defensives in this market as a potential leading sign about growth expectations.
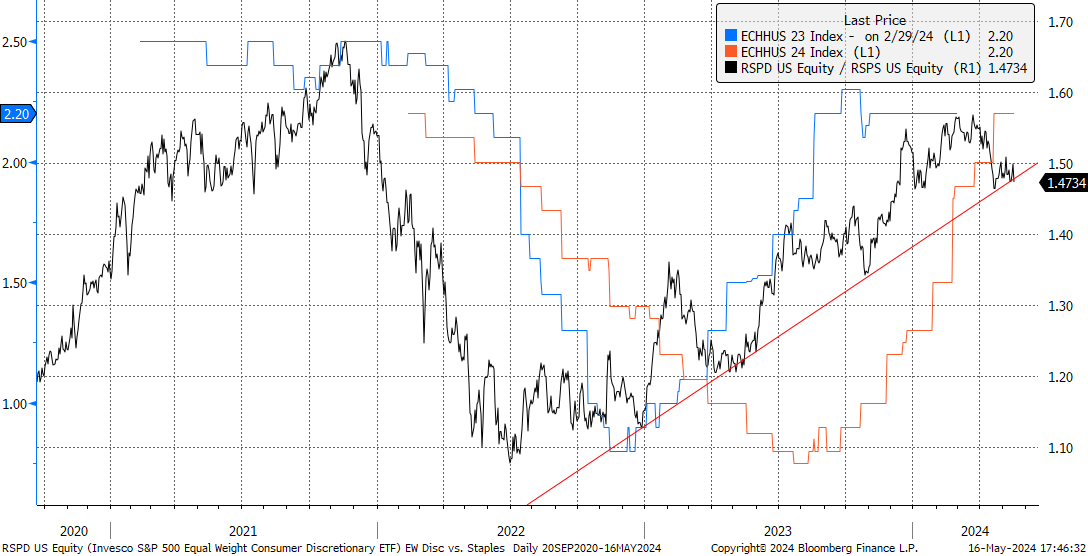
Our must-watch indicator of equal weight Consumer Discretionary vs. Consumer Staples is sitting at a precarious level, with trading action in the coming week an important test to see if this ratio is going to begin trending lower. Weaker Discretionary vs. Staples could signal risk to Household Consumption forecasts going forward.
Equal Weight Consumer Discretionary vs. Consumer Staples Household Consumption Forecasts for 2023 and 2024
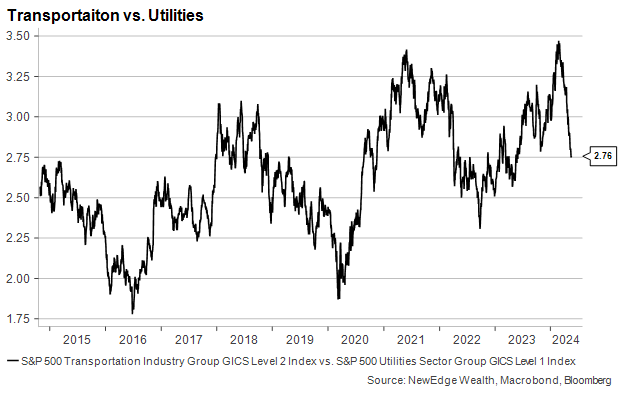
Another cyclical vs. defensive ratio, Transportation vs. Utilities, has broken down sharply in recent weeks thanks to the strength in Utilities and lackluster performance of Transports. This ratio often trends lower in risk-off environments (2015, 2018, 2022), but this surge in Utilities does have a different flavor today given the AI-narrative boosting Utilities. This is in contrast to the classic “flight to safety” bid that Utilities often enjoy when growth outlooks are being questioned. Regardless, we think this ratio should still be monitored, mostly if other cyclical vs. defensive ratios show similar breakdowns.
Conclusion
Repeating our opening summary:
Overall, we see this market as potentially supported by the tailwinds of technicals (momentum, breadth, trend), liquidity, rising EPS estimates (helped by share repurchases), and stable GDP estimates. This market is not without its headwinds, but these likely need a catalyst to begin to bite, such as continued weaker economic data that sparks GDP estimate cuts. We can take cues from factors like the outperformance of defensive sectors about the probability of this catalyst occurring, with these signals near flashing “yellow lights”. Factors like positioning, sentiment, and valuation rarely cause market volatility themselves, but they can add to potential volatility as they unwind from elevated/extreme levels.
IMPORTANT DISCLOSURES
Abbreviations/Definitions: EPS: earnings per share; GDP: gross domestic product; Moving average convergence divergence (MACD): a technical indicator that helps investors identify price trends, measure trend momentum, and identify market entry points for buying or selling. It is a momentum oscillator that appears on a chart as two lines that oscillate without boundaries. The crossover of the two lines gives trading signals similar to a two moving average system.
The Citigroup Economic Surprise Index (CESI) measures the difference between actual economic data and the expectations of market participants. A positive index value indicates that economic releases have been better than expected, while a negative value indicates that they have been worse than expected.
The Invesco S&P 500® Equal Weight Consumer Discretionary ETF (RSPD) is an exchange-traded fund that tracks the performance of the S&P 500 Equal Weight Consumer Discretionary Index. This index equally weights the stocks of companies within the consumer discretionary sector of the S&P 500, ensuring that each company has an equal impact on the index’s performance. This method provides greater exposure to smaller companies compared to a traditional market-cap weighted index
The Invesco S&P 500 Equal Weight Consumer Staples ETF (RSPS) is an exchange-traded fund that tracks the performance of the S&P 500 Equal Weight Consumer Staples Index. This index gives equal weight to each company in the consumer staples sector of the S&P 500, ensuring that smaller companies have the same influence on the index as larger ones. This approach contrasts with market-cap weighted indices, which give more weight to larger companies
The S&P 500 Transportation Industry Group (GICS Level 2) Index is part of the Global Industry Classification Standard (GICS) structure, which organizes companies into specific sectors and industries. This particular index tracks the performance of companies within the transportation industry that are part of the S&P 500. It includes various sub-industries such as air freight and logistics, airlines, marine transportation, and railroads, reflecting a broad view of the transportation sector within the larger S&P 500 index.
The S&P 500 Utilities Sector Index (GICS Level 1) includes companies within the S&P 500 that are classified under the utilities sector according to the Global Industry Classification Standard (GICS). This sector comprises firms that provide essential public services such as electricity, gas, and water, which are typically characterized by their stable revenue streams and regular dividends. The index serves as a benchmark for measuring the performance of the utilities sector within the broader S&P 500 index.
The views and opinions included in these materials belong to their author and do not necessarily reflect the views and opinions of NewEdge Capital Group, LLC.
This information is general in nature and has been prepared solely for informational and educational purposes and does not constitute an offer or a recommendation to buy or sell any particular security or to adopt any specific investment strategy.
NewEdge and its affiliates do not render advice on legal, tax and/or tax accounting matters. You should consult your personal tax and/or legal advisor to learn about any potential tax or other implications that may result from acting on a particular recommendation.
The trademarks and service marks contained herein are the property of their respective owners. Unless otherwise specifically indicated, all information with respect to any third party not affiliated with NewEdge has been provided by, and is the sole responsibility of, such third party and has not been independently verified by NewEdge, its affiliates or any other independent third party. No representation is given with respect to its accuracy or completeness, and such information and opinions may change without notice.
Investing involves risk, including possible loss of principal. Past performance is no guarantee of future results.
Any forward-looking statements or forecasts are based on assumptions and actual results are expected to vary from any such statements or forecasts. No assurance can be given that investment objectives or target returns will be achieved. Future returns may be higher or lower than the estimates presented herein.
An investment cannot be made directly in an index. Indices are unmanaged and have no fees or expenses. You can obtain information about many indices online at a variety of sources including: https://www.sec.gov/answers/indices.htm.
All data is subject to change without notice.
© 2025 NewEdge Capital Group, LLC