
So cut the headlights, summer’s a knife
“Cruel Summer” – Taylor Swift
August has been a cruel month for equity and bond investors. After a relatively bright and calm start to summer, with generally rising risk asset prices and low volatility, this month has been more challenging and tumultuous (to put it in Swift terms, June and July were in their 1989 era and August has been in its Folklore era… if you know, you know).
In reality, the August weakness started brewing in mid-July. The 2023 U.S. equity market leadership, including Tech, Growth, and the “Magnificent 7”, peaked in mid-July and began to underperform the S&P 500. Interestingly, the peak in each of these areas happened around July 18, the day that MSFT rallied nearly 6% on AI optimism, only to see those gains reverse over the following week.
Microsoft (MSFT)

Yields also kicked off their recent ascent at this mid-July time, with both the 10- and 30-Year Treasury bond yields rising over 50 bps since mid-July.
U.S. 10 Year Treasury Yield

As we wrote about last week, there is a stark difference between the recent weaker equity and bond prices and 2022’s bear markets. 2022’s cross-asset weakness was characterized by both the rapid repricing of interest rates as the Fed got a delayed start to its tightening cycle, and growth fears that added to risk asset weakness. These growth fears could be observed in equity earnings estimates being revised lower and credit spreads for investment grade and high yield bonds widening out substantially during 2022.
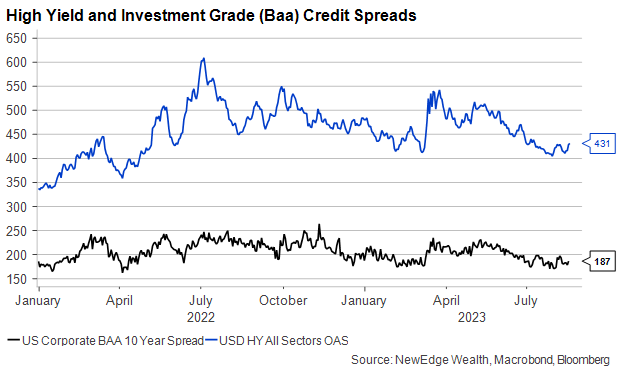
In contrast, this short bout of weakness in 2023 has not been about growth fears (it is hard to fear growth prospects when the Atlanta Fed GDPNow is running at 5.8% for 3Q23 versus a prior consensus estimate for 0.0% growth for the quarter!). For now, we have not seen earnings estimates get revised lower (though earnings estimates do lag), we have not seen a dash for ultra-defensive sectors like Utilities and Staples (which often coincides with rising growth concerns), and we have seen a slight, orderly widening in credit spreads.
Similar to 2022, today’s sell-off does have an aspect of repricing interest rates in response to the Fed and economic data, but it is taking on a different flavor. Importantly, this repricing has all happened at the long end of the yield curve (10- and 30-Year yields up 50 bps in the past 30 days), while the short end of the yield curve, which is more sensitive to near-term Fed policy, has not been as volatile (2-Year yields are up less than 20 bps in the past 30 days, with little change to expected Fed rate moves in the coming months as well, observed through Fed Funds Futures).

The recent jump higher in long-term yields is reflective of a confluence of factors that includes: better U.S. economic data, increased Treasury supply to finance the swelling fiscal deficit, decreased Treasury demand from foreign buyers (Japan and China), the Fed’s expressed hopes that it can cuts rates in 2024 if real rates rise (even if inflation remains above target, essentially implying that it could tolerate higher for longer inflation), and the discussion of a higher long-term neutral rate given economic resilience in the face of higher Fed policy rates.
Interestingly, the rise in yields is happening just as we near the one-year anniversary of Chairman Powell’s curt and hawkish speech at Jackson Hole, which jolted equity markets from their bullish summer slumber and catalyzed the sell-off into the October 2022 lows.
Despite Powell’s 2022 warning of “pain”, a “sustained period of below trend growth”, and “using our tools forcefully to bring demand and supply into better balance”, we have seen little evidence of the impact of higher rates slowing U.S. economic growth. As we wrote about a couple weeks ago, since the Jackson Hole “pain” speech, 3.2 million more people are employed, and economic output is $1.4 trillion higher in the past twelve months than it was in the prior twelve months. That is hardly pain.
At this year’s Jackson Hole Symposium happening next week, we expect a discussion about that elusive r* neutral rate, trying to make sense of economic resilience despite higher rates and broad expectations for weakness (we argue a big portion of it is pandemic distortions, fiscal support, and the long-tail of QE).
Looking tactically at these markets, we make the following observations:
For equities, we do expect the corrective period to continue in the near-term. Short term, U.S. equity indices are nearing oversold levels (essentially moving too far too fast to the downside, using measures like the relative strength index), which could support slight short-term stabilization, but note that we remain in a tough seasonal stretch through October, with September being the worst month on the year for a seasonal headwind.
Further, we have not quite seen a “washout” in equity market breadth, using measures like the percentage of issues above their 50-day moving average (at 34% today vs. 90% at the end of July before the sell-off, but still above the ~20% level that has indicated broader capitulative selling, meaning we are getting closer to “flushed” but not quite).
We are starting to see a spike in downside protection (looking at measures like the put-call ratio), but these have not reached prior extremes yet. For now, we expect a “standard” and healthy U.S. equity correction (throughout U.S. equity history, high-single-digit to low-teen corrections are common even during the most powerful bull markets) that can provide an entry point for underweight investors, but of course will remain vigilant in monitoring for signs of rising growth fears that could increase downside.

For fixed income, we expect an upward bias on yields until we see cracks in the economic growth picture, which could revive hopes for an easier Fed and lower inflation. We continue to expect that in order to see a significant move lower in yields we will need to see signs of much weaker economic growth. We could see a short-term digestion of the sharp move higher in yields (like equities being oversold, the U.S. 10-Year yield screens as being slightly overbought). We are monitoring credit spreads closely as well, with rising spreads being a sign of increasing growth fears. Our view remains that the majority of 2023 fixed income returns will come from coupon yields and not price appreciation.
Overall, despite the U.S. Taylor Swift Eras tour wrapping for 2023 (some argue it boosted economic growth!), this Cruel Summer for bonds and stocks could continue in the coming weeks, providing investors who may be underweight risk assets opportunity to add to positions in order to work towards long-term, strategic goals.
Top Points of the Week
By Austin Capasso

1. US Equities continue their underperformance – All three major US equity indices took losses on the week with the S&P 500, Nasdaq, and Dow Jones Industrial indexes down over 2%. The Dow is on track to fall below its 50-day moving average, an important short-term technical level for trends in the market. Similarly, the Nasdaq 100 closed below its 50-day moving average for the first time in 103 trading days, ending what was just the 11th streak of 100 or more trading days of closes above its 50-day moving average (DMA) since 1985.
2. 10-year and 30-year Treasury yields surge – This week the 30-year Treasury yield ascended to 4.42%, reaching its highest level since 2011. Similarly, the US 10-year yield approached 4.31%, coming within a few basis points of its peak in 2022, a threshold that had remained untouched since 2007. The driving force behind these elevated yields stems from the resilience of economic data releases and Fed Minutes indicating there is more work to be done on the inflation front. Our question remains, when will yields start to become a headwind for markets?
3. USD breaks above its 200 DMA – The DXY index, which measures the price movements in the US Dollar, broke above its 200-day moving average for the first time since December 2022. Year to date, DXY is down 0.19%, but up over 2% month to date. We can attribute this ascent to an overall strong and resilient US economy. It is interesting that the USD rally is only against currencies with central banks that have been on hold.
4. Russian ruble worries, but no greater economic crisis in sight – The impact of the conflict with Ukraine, economic sanctions, and the upward trend in oil prices is now unmistakably sensed within the Russian economy. While the devaluation of the ruble initially offered some advantages to the Russian government’s budget, it has now depreciated to such an extent that it is adversely affecting the general population of Russia. This week’s fall has been so drastic the central bank finally has made the decision to increase interest rates as a measure to combat inflation.
5. China is continuing its struggles – China unveiled its latest economic data on Tuesday, encompassing industrial production, retail sales, and exports, all of which were disappointing results. China’s retail sales report was dismal, seeing just a 2.5% growth from July a year ago versus the 4.5% expected increase. It appears the reopening is starting to fizzle out as reopening leisure was only up 15% in July annualized, compared to 43% in April. China will likely need to inject even more stimulus into the system to achieve their growth target.
6. July UK Headline inflation release – UKHeadlineinflation was in line with expectations to 6.8% in July on a year over year basis, marking its lowest point in a span of 17 months. Core inflation remained unchanged at 6.9%, which was slightly above the forecast of 6.8% and continues to be a watch item for the Bank of England. Decisions on whether to pause or raise are still up in the air.
7. Fed Minutes release hint at further interest rate hikes – The Fed Minutes released on Wednesday and showed conflicting opinions amongst the members of the FOMC. Half of the members seemed to be in the camp pausing rate hikes and letting the economy naturally take its course of pushing inflation down, while the other half were in the camp of continuing the course of rate hikes to even more restrictive levels. Employment data will be a big factor in their decision making and Powell’s speech at Jackson Hole next week should provide some guidance for markets.
8. Gold on pace for worst losing streak in more than 6 years – Gold has fallen for eight consecutive sessions, coinciding with the 10-year US Treasury note yield reaching its highest levels since 2008 this week. The increase in yields and the resurgence of the dollar have worked in synchrony to drop gold prices. With the prospect of a soft landing becoming more and more promising, it becomes challenging to envision a scenario where gold makes a significant recovery without a recession.
9. Earnings Update with NVDA earnings next week – We are nearing the end of second quarter earnings season with 94% of S&P 500 companies having reported so far. Overall, 81% of these companies are beating earnings estimates, with those that “beat” doing it by a median of 7%. The 19% missing estimates are missing by a median of 6%. Of the 17 companies reporting this week, Nivida’s (NVDA) announcement on Wednesday is the marquee event. NVDA has been a bellwether for the technology sector so it will be interesting to see how the company reports.
10. Next Week: Powell’s speech at Jackson Hole, S&P Services & Manufacturing PMIs – The upcoming week holds significant importance for assessing manufacturing and services trends, as well as a highly anticipated speech from Jerome Powell at Jackson Hole. After the previous year’s speech from Powell at Jackson Hole, markets had a huge sell off after he came out at peak hawkishness. Other notable economic data include durable goods orders, existing home sales, and U Mich Consumer Sentiment.
IMPORTANT DISCLOSURES
Abbreviations/Definitions: AI: artificial intelligence; DMA: day moving average; Fed Fund Futures: derivatives that measure expectations of Fed policy; FOMC: Federal Open Market Committee; Powell: Jerome Powell, Chair of the Board of Governors of the Federal Reserve System; R* neutral rate: the real neutral rate of interest that equilibrates the economy in the long run, it is the real interest rate that is neither expansionary nor contractionary when the economy is at full employment; University of Michigan Consumer Sentiment Index: a survey of personal consumer confidence in economic activity, which is used to estimate future spending and saving.
Index Information: All returns represent total return for stated period. S&P 500 is a total return index that reflects both changes in the prices of stocks in the S&P 500 Index as well as the reinvestment of the dividend income from its underlying stocks. Dow Jones Industrial Average (DJ Industrial Average) is a price-weighted average of 30 actively traded blue-chip stocks trading New York Stock Exchange and Nasdaq. The NASDAQ Composite Index measures all NASDAQ domestic and international based common type stocks listed on the Nasdaq Stock Market. Russell 2000 is an index that measures the performance of the small-cap segment of the U.S. equity universe. MSCI International Developed measures equity market performance of large, developed markets not including the U.S. MSCI Emerging Markets (MSCI Emerging Mkts) measures equity market performance of emerging markets. Russell 1000 Growth Index measures the performance of the large- cap growth segment of the US equity universe. It includes those Russell 1000 companies with relatively higher price-to-book ratios, higher I/B/E/S forecast medium term (2 year) growth and higher sales per share historical growth (5 years). The Russell 1000 Value Index measures the performance of the large cap value segment of the US equity universe. It includes those Russell 1000 companies with relatively lower price-to-book ratios, lower I/B/E/S forecast medium term (2 year) growth and lower sales per share historical growth (5 years). The BBB IG Spread is the Bloomberg Baa Corporate Index that measures the spread of BBB/Baa U.S. corporate bond yields over Treasuries. The HY OAS is the High Yield Option Adjusted Spread index measuring the spread of high yield bonds over Treasuries. The U.S. Dollar Index (DXY) tracks the strength of the dollar against a basket of major currencies. DXY was originally developed by the U.S. Federal Reserve in 1973 to provide an external bilateral trade-weighted average value of the U.S. dollar against global currencies. Atlanta Fed GDPNow index is a “nowcast” of real GDP growth based on available economic data for the current measured quarter.
Sector Returns: Sectors are based on the GICS methodology. Returns are cumulative total return for stated period, including reinvestment of dividends.
The views and opinions included in these materials belong to their author and do not necessarily reflect the views and opinions of NewEdge Capital Group, LLC.
This information is general in nature and has been prepared solely for informational and educational purposes and does not constitute an offer or a recommendation to buy or sell any particular security or to adopt any specific investment strategy.
NewEdge and its affiliates do not render advice on legal, tax and/or tax accounting matters. You should consult your personal tax and/or legal advisor to learn about any potential tax or other implications that may result from acting on a particular recommendation.
The trademarks and service marks contained herein are the property of their respective owners. Unless otherwise specifically indicated, all information with respect to any third party not affiliated with NewEdge has been provided by, and is the sole responsibility of, such third party and has not been independently verified by NewEdge, its affiliates or any other independent third party. No representation is given with respect to its accuracy or completeness, and such information and opinions may change without notice.
Investing involves risk, including possible loss of principal. Past performance is no guarantee of future results.
Any forward-looking statements or forecasts are based on assumptions and actual results are expected to vary from any such statements or forecasts. No assurance can be given that investment objectives or target returns will be achieved. Future returns may be higher or lower than the estimates presented herein.
An investment cannot be made directly in an index. Indices are unmanaged and have no fees or expenses. You can obtain information about many indices online at a variety of sources including: https://www.sec.gov/answers/indices.htm.
All data is subject to change without notice.
© 2025 NewEdge Capital Group, LLC