
Weekly Summary: September 13 – 17, 2021
Key Observations:
- The 10-year Treasury yield traded in a relatively narrow range — between 1.28%-1.35% — from September 1, 2021, through the 16th of the month, with only two of those days below 1.30%. Thus, we believe that interest rates are in a holding pattern (before rising), awaiting the next Fed pronouncement.
- This week’s better than expected August U.S. retail report is a good indication of continuing strong demand for goods and services.
- Supply disruptions and shortages, some of which have been exacerbated by increased concerns over the Delta variant, have contributed to a decrease in the U.S. production of goods and services.
The Upshot: We believe that strong consumer demand and continuing supply constraints will pressure prices to the upside. Due to the uneven effects of the coronavirus, we would not be surprised if inflation, employment and economic growth rates continue to fluctuate on a monthly basis. Nevertheless, we expect inflation to be more persistent and higher than many expect in the intermediate-term.
It’s a Swing and a Miss for the Consumer
We believe that driving factors behind the lower-than-expected U.S. Consumer Price Index (CPI) announced this week for August were primarily due to more volatile components of the index, such as airfares, which were down over 9%, as well as lodging away from home (hotels) down almost 3% month-over-month, and finally used car prices that fell 1.5% month-over-month. We view these factors that led to a weaker than expected CPI as “transitory” and mainly due to effects from increasing concerns over the Delta variant. These concerns have somewhat slowed the reopening of the U.S. economy and delayed the rotation from spending on goods to increased spending on services. This delay has also restrained any further CPI increase. On the other hand, the less variable components of CPI, such as shelter costs, maintained a solid pace of growth.
In our opinion, inflation will prove to be more persistent and higher than the Federal Reserve (Fed) believes. The Fed continues to label the higher-than-expected inflation that has persisted for several months as “transitory.” Evidently, we also differ from the Fed in our definition of transitory. As a result, we anticipate that the unexpected CPI weakness will reverse and trend higher over the next few months.
Source – J.P. Morgan, State of the Business, Inventory and Capex Cycles, US Consumer, Revising Earnings, Capital Return (9/15/2021)

Source – Citi, The Daily Update (9/15/2021)
Producer Price Index Comes in on Cue
A few days before the CPI announcement, a slightly higher-than-expected U.S. Producer Price Index (PPI) was announced. The headline (top line) PPI was helped by an almost 3% month-over-month increase in food prices and a 0.4% month-over-month increase in energy prices. Food prices are not part of the core PPI, and are assumed to be more volatile and less indicative of a consistent trend. Still, price increases for processed foods appear to be more persistent and therefore more likely to eventually put upward pressure on CPI measures. Processed food inflation on both a one-and two-year basis exceeded 10%, representing the highest such increase since 1980. The core PPI was less than expected, more “mixed,” and less clear.

Source – J.P. Morgan, Analysis of Food-at-Home PPI Data (9/10/2021)
Non-U.S. Prices Also Matter
The variability of prices on a month-to-month basis was also shown in U.S. import and export prices for August 2021. Overall, U.S. export prices increased by 0.4% month-over-month and by 16.8% year-over-year, the smallest increase since October 2020. On the other hand, overall monthly U.S. import prices were lower in August for the first time in 10 months, by 0.3% month-over-month, mostly reflecting a decline in the cost of petroleum products. But the costs of goods imported from China increased by 0.4% month-over-month. The principal reason we note these export and import prices is to keep in mind that prices in the rest of the world can impact the U.S. Rising import prices help increase domestic inflation expectations and make it easier for U.S. companies that sell similar goods to raise their prices as well — particularly when it comes to its major trading partners, such as China.
The divergence between China’s PPI and CPI continued to expand in August. Its CPI was +0.8% year-over-year, while its PPI increased to 9.5% year-over-year, the fastest annual growth since September 2008. The composition of these two measures is quite different in China. The CPI was held down by certain lower-priced food items, easing of energy prices and the impact of restrained near-term consumer spending due to restrictions related to the latest coronavirus outbreak. Significant price increases in coal processing mainly impacted the PPI due to strong demand and tight supply conditions.
We don’t expect much follow-through to China’s CPI. But, strangely enough, the significant increases in China’s PPI could exert upward pressure on U.S. CPI in the months ahead. This has often been the case historically. Shipping costs of goods imported from China into the U.S. remain elevated and are expected to continue exerting upward price pressure on these goods. Rising import prices, including elevated shipping costs, should continue to apply upward inflation pressures in the U.S.


Source – Bloomberg, China Factory Inflation Surge to Add Pressure to Global Prices (9/9/2021)
The Realities of Strong Demand but Limited Supply
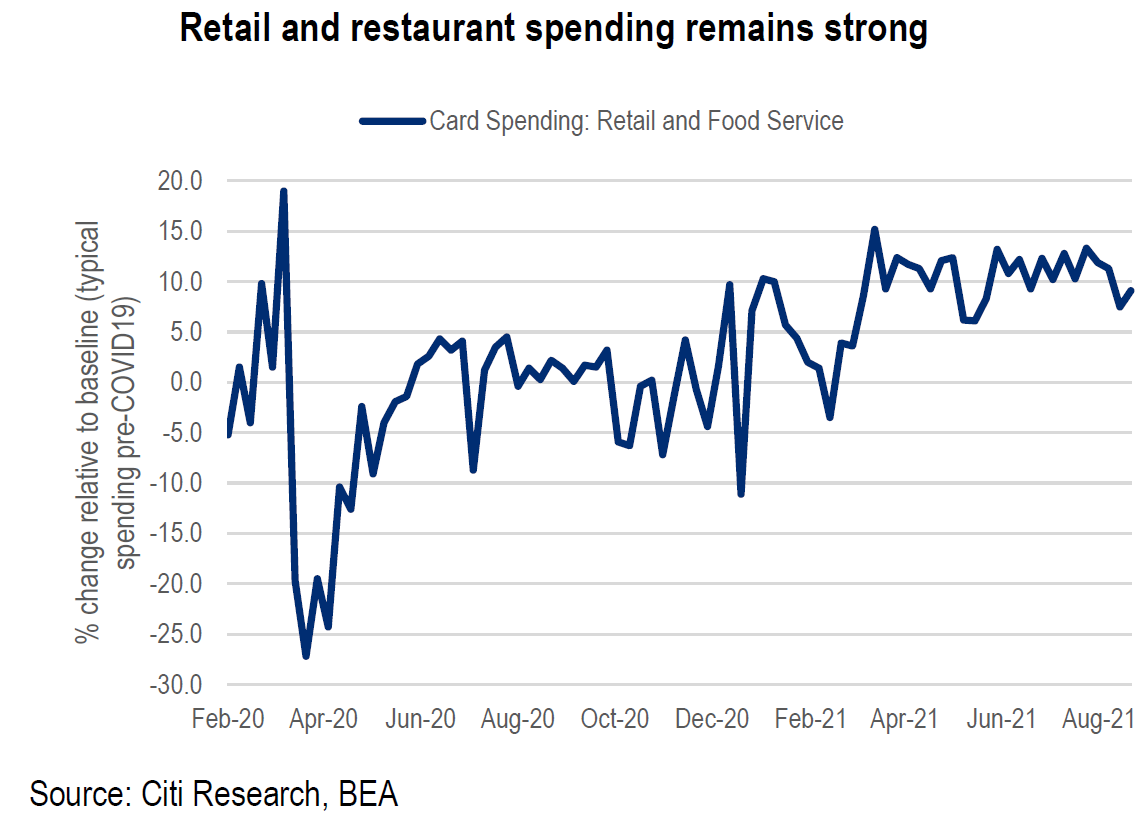
Everyone knows that all else being equal, strong demand and limited supplies, should lead to higher prices. The unexpectedly robust U.S. August retail figures supported our confidence that U.S. demand for goods and services remains strong. Retail sales increased by 0.7% month-over-month versus an expected decrease of at least 0.7% month-over-month. Excluding auto sales, the increase was 1.8% month-over-month. Presumably, fear of the Delta variant was also somewhat responsible for the 5.3% month-over-month increase for online sales.
General merchandise and clothing-related sales were especially strong. Back-to-school-related sales, with many students having missed a year of in-person attendance, were also helpful. According to a September 16, 2021, Citi Research report, child tax benefit payments that began to be distributed in mid-July were beneficial for retail sales as well. These benefit payments are expected to continue over the next several months.
Although retail sales were revised lower for July 2021, we still view the August 2021 retail sales figures as indicative of strong underlying consumer demand for goods and services. In fact, in its September 16, 2021, report, J.P. Morgan (JPM) believed that the revised July figures were better aligned with the July drop in consumer spending as reflected in Chase’s consumer spending data. We, like JPM, surmise that the Delta variant played a significant role in the pace and composition of consumer spending. Therefore, we still expect services spending to rebound substantially when the Delta variant is more obviously under control.
Supply constraints, mostly now due to the Delta variant, obviously continue to affect automobiles’ production, sale, and pricing. The shortages of needed semiconductors will likely last well into 2022. In addition, supply chain issues and scarcity of qualified workers and raw materials continue to be reported in many surveys of various businesses. These surveys consistently report worker shortages, raw materials shortages, supply chain disruptions and continued higher prices paid and received.
A statement that exemplified the general tenor of recent surveys was made by the chief economist of the NFIB Small Business Association, who said that “the biggest problem facing small employers right now is finding enough labor to meet their demand, and for many, managing supply chain disruptions.” In fact, a record high of 50% of small business owners reported job openings that they could not fill. As a result, the number of owners expecting better business conditions over the next six months decreased in August for the second consecutive month. But, again, it appears that demand is not the problem – it is the ability to produce to meet the existing demand.
Impact of Wage Increases on Companies – Size Matters
In general, larger companies have higher margins, more pricing power and are more optimistic about future business prospects. Because of their generally higher margins, larger companies are also better able to absorb increased wages. As we wrote in our letter last week, tight labor markets continue to produce wage gains in many industry groups, especially the Leisure and Hospitality services sector.

Source – J.P. Morgan, US Weekly Prospects (9/10/2021)
In our prior letters, we have often stated that continued wage inflation and high inflation expectations are very supportive of a more persistent type of inflation. Goldman Sachs estimated that wages grew at a rate of 3.2% (and faster for lower-paid workers) in Q2, the fastest pace since 2008. Wages make up approximately 13% of the median S&P 500 company’s revenues. Industrials and Communication Services seem to be especially exposed, in terms of margins, to higher wages. Other industry groups vulnerable to higher wages include tech hardware, consumer services, capital goods and transports.
Small caps are more exposed to rising wages, partly due to their generally narrower margins. Companies comprising the Russell 2000 (an index of relatively small companies) have labor costs that equate to 16% of aggregate revenues, whereas the comparable figure for the S&P 500 companies is 11%. Across all U.S. companies of all sizes, the comparable figure is 28% of revenues, which is in line with the past 30 years. As wages have continued to rise, perhaps this is one of the reasons why the Russell 2000 has underperformed in the past few months relative to the other major U.S. stock indexes.


Source – Goldman Sachs, Labor costs and US equities: Temporarily transitory (9/13/2021)
Expectations Often Become Reality When It Comes to Inflation
As we have often stated, a key ingredient in turning inflation into a more persistent type is that consumers must have high inflation expectations. Many surveys continue to show such expectations. The results of one such survey were released Monday by the Federal Reserve Bank of New York. This is a nationwide survey of approximately 1,300 rotating households. It showed that inflation expectations for one year ahead increased in August for the 10th straight month, to a median of 5.2% (4.9% last month), and for the next three years to a median of 4.0% (3.7% last month). These are the highest readings for this survey which was first launched in 2013. But remember, these are median expectations. There is a tremendous underlying diversity of opinion regarding inflation expectations.

Source – Reuters, U.S. consumers’ inflation expectations highest since 2013, NY Fed says (9/13/2021)
Bottom Line
In our opinion, two critical elements needed for persistent inflation are increasing wages and elevated inflation expectations. We currently have both of these elements. Therefore, we conclude that the dip in the U.S. August CPI was transitory. We define transitory to be one to three months. The Fed’s definition of transitory is obviously longer than ours because inflation has already been running above their expectations for many months.
So far, consumer inflation expectations seem to be rising in a very consistent pattern for many months. Consumers seem able to look past the more variable monthly statistics on inflation, employment and economic growth rates. Nevertheless, there remains a wide dispersion among consumer expectations.
In general, wages are a higher percentage of sales in smaller companies compared to larger ones. Of course, this percentage varies greatly across industries. Smaller companies typically have less pricing power for prices they receive and less bargaining power regarding input prices and supplies. Their margins are also typically smaller, resulting in less ability to absorb higher wages.
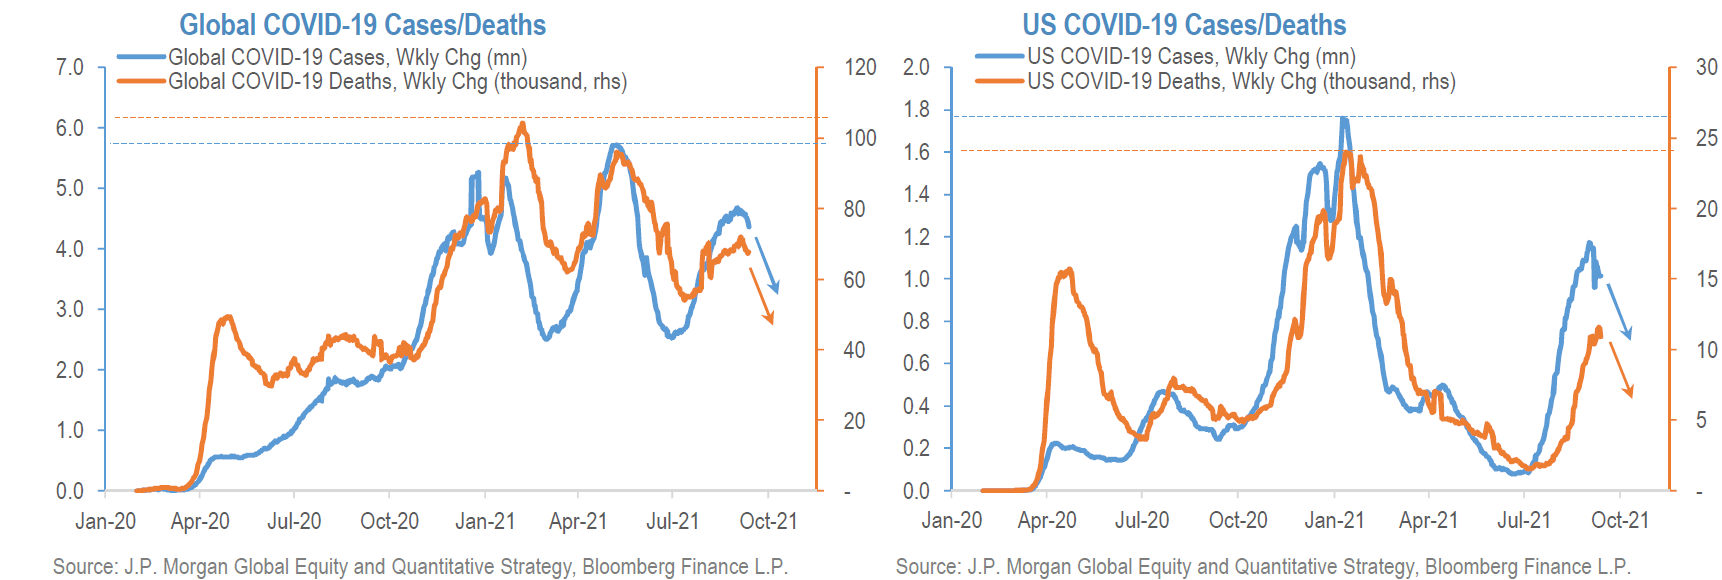
We still expect that the Delta variant will become more manageable in the very near future in many parts of the world, including the U.S. But the longer that the Delta variant and possibly other new variants remain an issue, the more likely that small businesses will become more pessimistic about their future prospects.
Extra Credit: Charts of Interest

Source – J.P. Morgan, US Weekly Prospects (9/10/2021)

Source – Citi, IP still rising despite hurricane and supply issues (9/15/2021)


Source – J.P. Morgan, US: PPI increases 0.7% in August (9/10/2021)


Source – J.P. Morgan, China: CPI inflation eased further in August; PPI surprised on the upside (9/9/2021)

Source – Goldman Sachs, Asia in Focus: Supply chain stresses (9/15/2021)

Source – Goldman Sachs, Global Markets Comment: Ten Questions on Cyclical Relief (9/9/2021)


INDEX DEFINITIONS
KBW Nasdaq Bank Index (BKX): The KBW Bank Index is designed to track the performance of the leading banks and thrifts that are publicly-traded in the U.S. The Index includes 24 banking stocks representing the large U.S. national money centers, regional banks and thrift institutions.
MSCI EM Value Index: The MSCI Emerging Markets Value Index captures large and mid cap securities exhibiting overall value style characteristics across 27 Emerging Markets (EM) countries.
MSCI EM Index: The MSCI Emerging Markets Index captures large and mid cap representation across 27 Emerging Markets (EM) countries.
NASDAQ: The Nasdaq Composite Index is the market capitalization-weighted index of over 2,500 common equities listed on the Nasdaq stock exchange.
PCE: Personal Consumption Expenditures (PCEs) refers to a measure of imputed household expenditures defined for a period of time.
Russell 1000 Growth: The Russell 1000 Growth Index measures the performance of the large-cap growth segment of the U.S. equity universe. It includes those Russell 1000 companies with higher price-to-book ratios and higher forecasted and historical growth values.
Russell 1000 Value: The Russell 1000 Value Index measures the performance of the large-cap value segment of the U.S. equity universe. It includes those Russell 1000 companies with lower price-to-book ratios and lower expected and historical growth rates.
S&P 500: The S&P 500 Index, or the Standard & Poor’s 500 Index, is a market-capitalization-weighted index of the 500 largest publicly-traded companies in the U.S.
VIX: The VIX Index is a calculation designed to produce a measure of constant, 30-day expected volatility of the U.S. stock market, derived from real-time, mid-quote prices of S&P 500® Index (SPX℠) call and put options.
Z-Score: A Z-score (also called a standard score) gives an idea of how far from the mean a data point is. It is a measure of how many standard deviations below or above the population mean a raw score is.
IMPORTANT DISCLOSURES
The views and opinions included in these materials belong to their author and do not necessarily reflect the views and opinions of NewEdge Capital Group, LLC.
This information is general in nature and has been prepared solely for informational and educational purposes and does not constitute an offer or a recommendation to buy or sell any particular security or to adopt any specific investment strategy.
NewEdge and its affiliates do not render advice on legal, tax and/or tax accounting matters. You should consult your personal tax and/or legal advisor to learn about any potential tax or other implications that may result from acting on a particular recommendation.
The trademarks and service marks contained herein are the property of their respective owners. Unless otherwise specifically indicated, all information with respect to any third party not affiliated with NewEdge has been provided by, and is the sole responsibility of, such third party and has not been independently verified by NewEdge, its affiliates or any other independent third party. No representation is given with respect to its accuracy or completeness, and such information and opinions may change without notice.
Investing involves risk, including possible loss of principal. Past performance is no guarantee of future results.
Any forward-looking statements or forecasts are based on assumptions and actual results are expected to vary from any such statements or forecasts. No assurance can be given that investment objectives or target returns will be achieved. Future returns may be higher or lower than the estimates presented herein.
An investment cannot be made directly in an index. Indices are unmanaged and have no fees or expenses. You can obtain information about many indices online at a variety of sources including: https://www.sec.gov/fast-answers/answersindiceshtm.html or http://www.nasdaq.com/reference/index-descriptions.aspx.
All data is subject to change without notice.
© 2024 NewEdge Capital Group, LLC


