
Weekly Summary: May 24 – 28, 2021
In science, it’s well-known that the more complex something is, the more fragile it becomes. Globalization was deflationary—but made the world more complicated. Then came the pandemic, which revealed the fragility of the world’s interconnected economies, made “supply chain disruption” a buzzword, and accelerated many trends. Top of mind is technology, specifically economic digitization. But strangely enough, the pandemic has also sped up the deglobalization of the past few years. Companies now strive to have at least some supply chains more local and diversified, judging that the reward of cost savings isn’t worth the risk of concentration. A more diverse set of supply chains most likely will be inflationary at the margin.
Key observations:
- With sector volatility increasing, the financial markets appear to be at a turning point.
- We continue to take advantage of volatility among sectors, commodities, interest rates and currencies ahead of “rolling” economic re-openings.
- We believe many equity investors should consider including more foreign exposure either through U.S. stocks with significant footprints overseas or directly via foreign company stocks.
The upshot: Active, selective money managers who are more fundamentally oriented should outperform passive strategies in the current environment.
Neither here nor there?
It seems that everything about the pandemic has been characterized by speed. Global economic shutdowns have occurred literally overnight. Rapid responses featured massive fiscal and monetary stimuli, especially in the U.S. Vaccines were developed in record time but distributed unevenly. Economies rebounded just as quickly.
The result has been fast but often dramatically uneven recoveries worldwide. The financial markets perceived major trends and sped to get in front of expectations as if they were reality. Many Wall Street firms believe that the U.S. rate of economic growth will peak in the current quarter, economic growth rates in Europe will top out in the third quarter, and emerging markets will hit their stride even later. Historically, as the euro has strengthened and the U.S. dollar weakened, emerging market equities have tended to benefit. For now, the dollar seems range-bound yet somewhat unstable, hovering near the lows reached early this year. Indeed, on May 21, JPMorgan said this pattern could continue for a few more months.
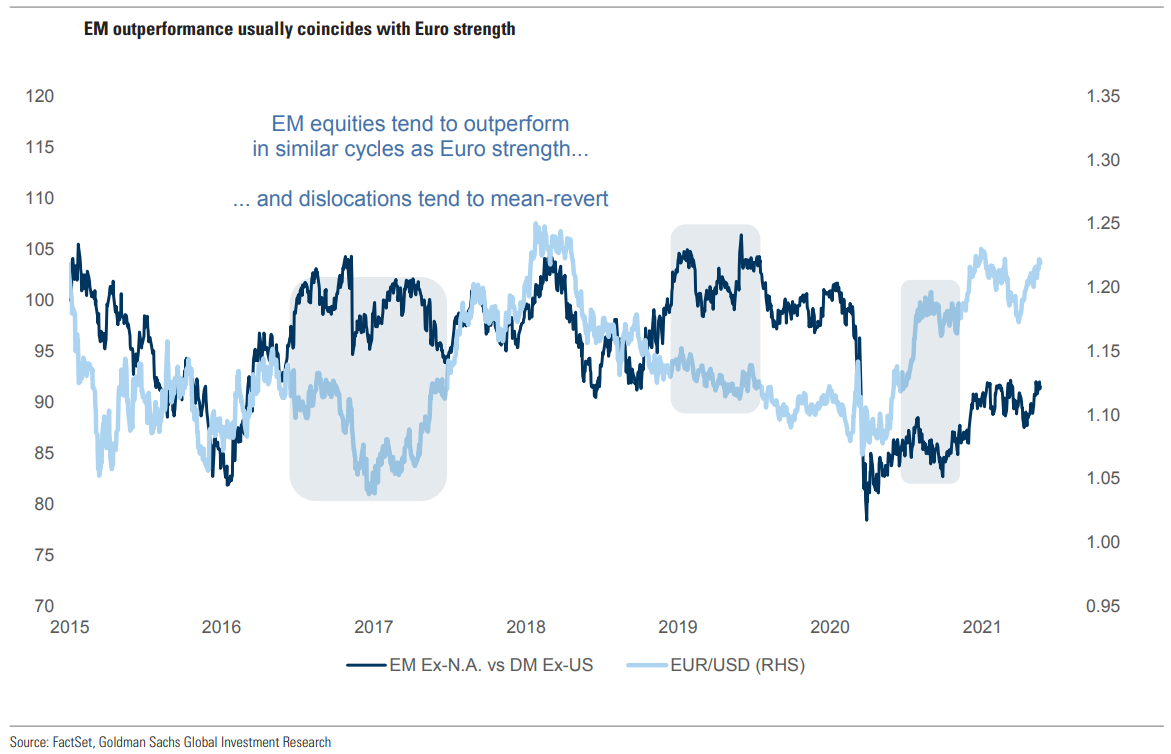
Goldman Sachs – Global Markets Daily: Looking ex-US: EM’s Equity Drawdown vs. Beta Matrix (Maasry/Gray) – 5/25/2021
Beyond borders
A weaker U.S. dollar also helps bolster U.S. inflation, benefits commodities, boosts emerging markets and makes foreign revenues more valuable for domestic companies when translated back into dollars. Indeed, as FactSet reported on May 21, U.S. companies with a high percentage of foreign revenues—including information technology (58% of revenues) and communication services (25%)—saw revenue growth outperform expectations across the board in 1Q.
Because foreign economic growth rates are expected to peak after the U.S.’s does, it could make sense for a balanced equity portfolio to have some foreign exposure. Some money managers have tried to anticipate these trends by trading aggressively, which has resulted in record-low tech allocations.
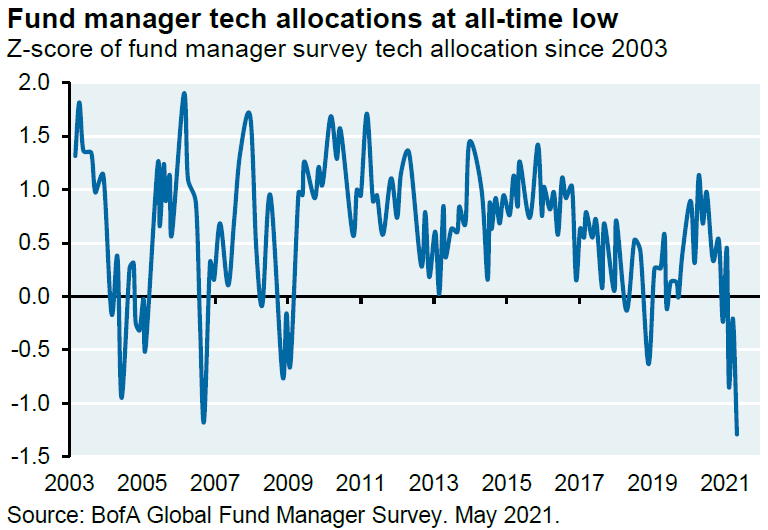
JP Morgan – EYE ON THE MARKET – 05/24/2021
The above chart relates to mutual funds. A Z-score (also called a standard score) gives an idea of how far from the mean a data point is.
It is a measure of how many standard deviations below or above the population mean a raw score is.
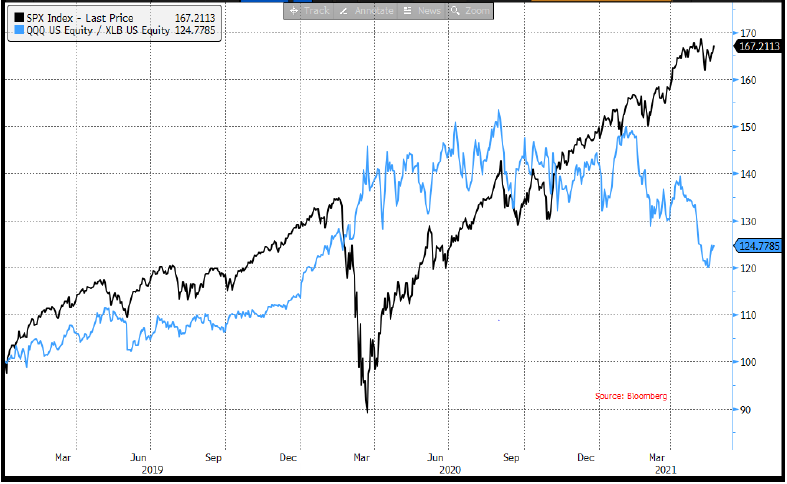
In its May 21 report, Goldman Sachs discovered that mutual funds and hedge funds have similar tilts in their portfolios. Even so, there are notable exceptions: Many mutual funds hold large overweight positions in financials, while many hedge funds hold just the opposite. Meanwhile, many hedge funds are overweight (relative to mutual funds) in stocks like Amazon, Apple, Facebook, Google, and Microsoft. These companies represent a big chunk of the Nasdaq 100 Index, and they recently underperformed more cyclical and value stocks, such as in the materials sector.
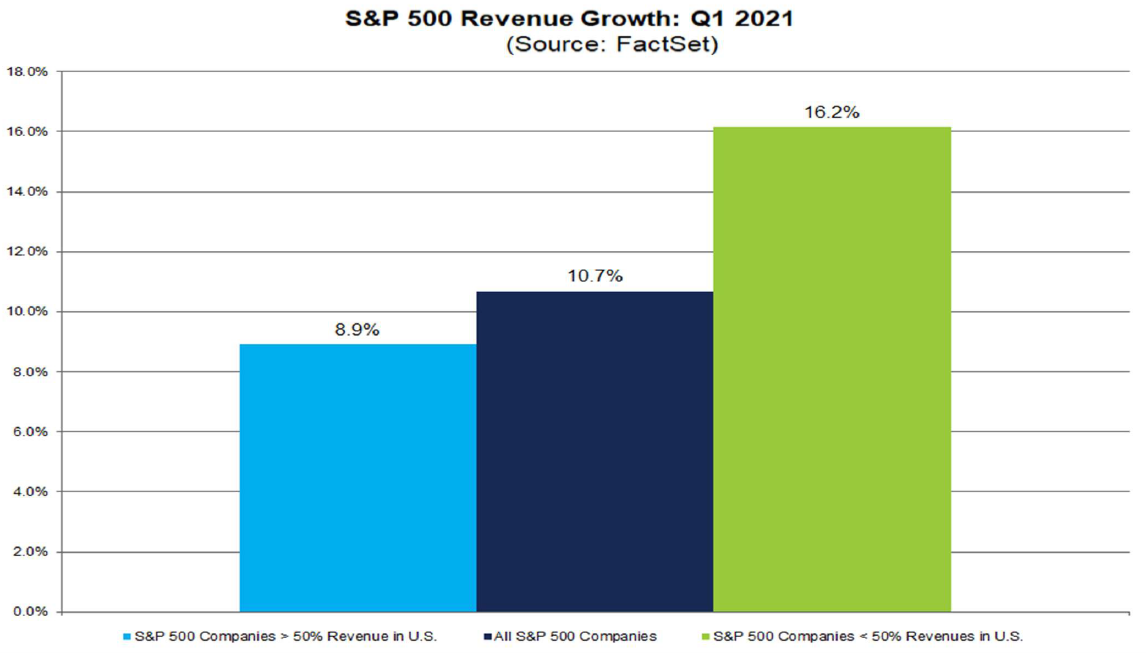
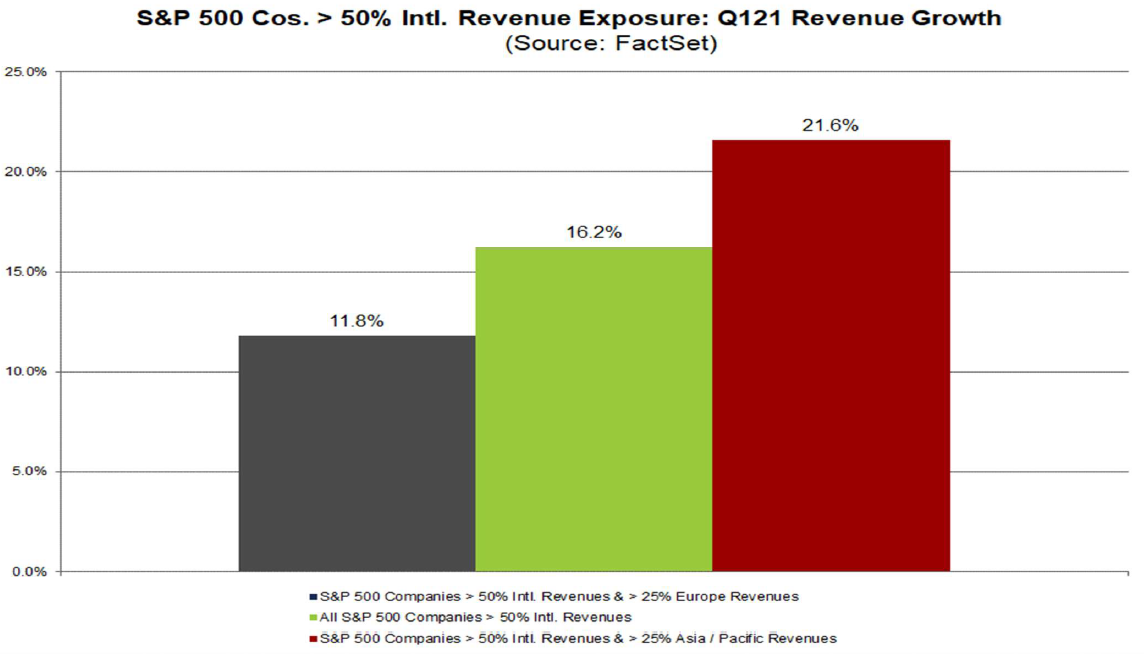
FactSet – Earnings Insight – 05/21/2021
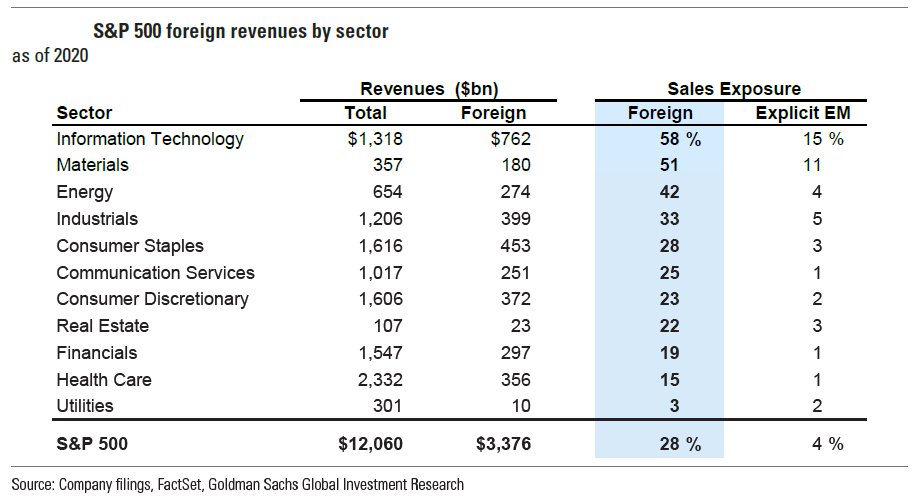
Goldman Sachs – 2021 Portfolio Passport: Analyzing foreign sales exposure of US firms – 05/24/2021
JP Morgan – US MARKET INTELLIGENCE: AFTERNOON BRIEFING – 05/24/2021
QQQ: Invesco QQQ is an exchange-traded fund that tracks the Nasdaq-100 Index™; XLB: The Materials Select Sector SPDR® Fund,
SPX: S&P 500 index is a cap weighted (by capitalization) average that tracks 500 of the largest publicly traded U.S. companies.
If this is a churning, volatile, relatively sidewise-trading equity market in the short or intermediate term, active managers who are selective could take advantage of these opportunities. Likewise, savvy stock pickers might be able to find individual buys in sectors such as industrials (recently downgraded by Morgan Stanley to underweight), which generally don’t appear favorable due to input prices squeezing margins.
Promising domestic data
U.S. economic data remained strong across the board. For example, although new-home sales weakened due to low inventory and pending sales were down 4.4% in April vs. March, selling prices continued to surprise on the upside.
In other data, the Philadelphia Fed nonmanufacturing and Kansas City Fed manufacturing surveys for May continued to show expanding activity and big price increases, some of which were expected to continue for at least another 6 months. The great majority of respondents expected to raise wages by various amounts, with 84% of firms saying they “cannot find workers with required skills.”
Everywhere one looks there is evidence of strong economic growth and continuing price increases. U.S. jobless claims were lower than expected amid continued rising COVID-19 vaccinations and falling case counts. And even though durable goods orders declined by 1.3% in April (vs. an expected increase of 0.9%), excluding transportation (down 6.7%), orders actually grew by 1%. Real GDP (adjusted for inflation) rose at an annual rate of 6.4% for the first quarter (vs. 4Q20); although modestly below expectations, it matched the “advance” estimate released last month.
Overall, most of this data shows an expanding economy which continues to power price increases across many goods and services.
Rates said Fed?
Perhaps the most distorted economic indicator is generally low interest rates, which sank even lower early this week despite the week’s strong economic and inflation data. It wasn’t until Thursday that the 10-year Treasury yield finally reacted positively to the U.S. economic news, adding at least 4 bps, to 1.61%.
Indeed, the continued strong economic data and price rises appear to have little impact on rates, which seem to respond only to what the Fed does or says. This week various Fed officials remarked that price spikes would only be temporary—and even if that turned out to be wrong, the U.S.’s central bank has the tools to bring inflation quickly under control.
Really? The world has never been more complex, interconnected, and, yes, fragile. Are these factors fully appreciated? Once wage growth becomes more entrenched along with increasing inflation expectations, prices might become harder to control. Today’s great irony is that despite what may be the quickest and most powerful economic recovery of all time—and the world changing at remarkable speed—the Fed (along with many other central bankers) has decided to take it slow. They have told us how they intend to react. With apologies to Eric Clapton, is the Fed really the new “Slowhand”?
Other Distortions!
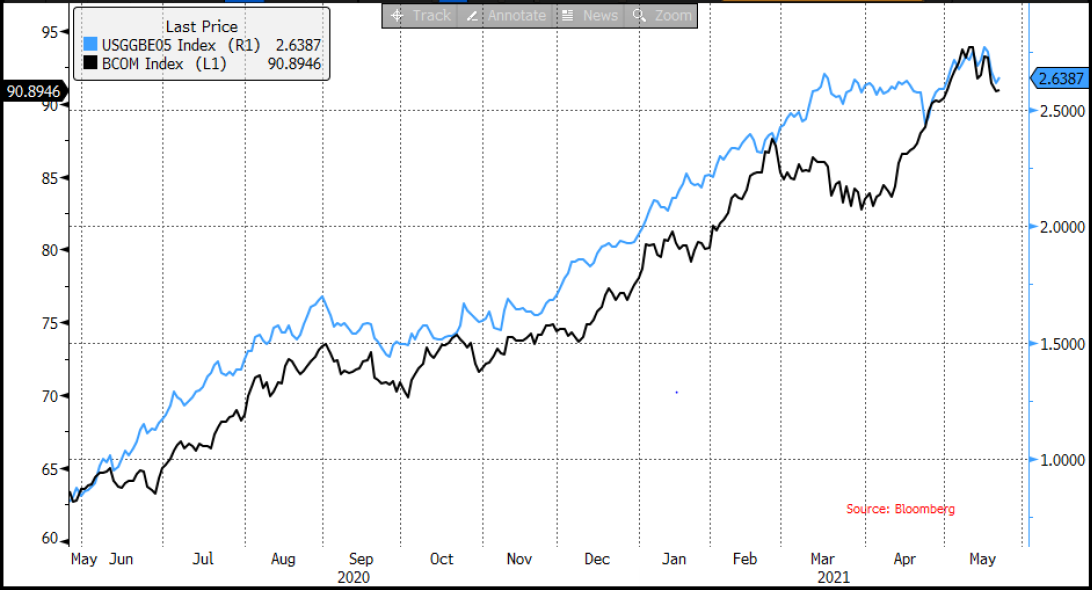
Many investors sense an inflection point in financial markets. On May 24, Morgan Stanley even anticipated a possible S&P 500 correction of as much as 20% from its peak. Others are looking past intermediate volatility to when perception becomes reality—and their investment thesis can be realized. Is this akin to the Federal Reserve looking beyond what they consider to be temporary inflation spikes? Perhaps, but sometimes things become distorted. Witness the 5-year breakeven Treasuries, which have tracked commodities rather closely.
5Y BREAKEVENS vs. BBG COMMODITY INDEX
JP Morgan – US MARKET INTELLIGENCE: AFTERNOON BRIEFING – 05/24/2021
Bloomberg Commodity Index (BCOM) is calculated on an excess return basis and reflects commodity futures price movements. The index rebalances annually weighted 2/3 by trading volume and 1/3 by world production and weight-caps are applied at the commodity, sector and group level for diversification. Roll period typically occurs from 6th-10th business day based on the roll schedule. 5 year breakeven – The 5 year TIPS/Treasury Breakeven rate is calculated as the difference between the 5 Year Treasury rate and the 5 year Treasury inflation indexed security.
But China is now exerting tremendous pressure on the commodity markets to maintain more stable pricing. In fact, it’s succeeded in rolling back commodity prices—at least temporarily. In fact, on May 27, base metals prices on the London Metal Exchange had already rebounded by an average 2.6%. Will correlations to other markets change? Maybe not. As JPMorgan noted on May 21, the day much higher-than-anticipated U.S. CPI was announced, Brent $100 calls traded at three times their normal volume for May. This could have been due to equity investors trying to hedge their portfolios against inflation risk. Given how much larger financial assets are than commodities, such moves could boost the smaller commodities markets—and end up creating a vicious cycle of higher commodity prices that lead to higher inflation, etc.
China’s version of inflation
Given China’s recent aggressive stances and actions, it might be instructive to examine how they are dealing with inflation. China has tried to directly control commodity prices by making it very clear that speculators should beware. But according to its May 27 report, Goldman believes China’s efforts will be in vain—that with the rapidity of growing commodities demand from other developed countries, China is no longer the marginal buyer. At the same time, it has quietly let its currency (yuan) appreciate to the highest level since 2016. A more valuable yuan helps to lower inflation within its borders, but it also means that it is exporting inflation to the rest of the world.
Even so, Chinese industry seems to be absorbing at least part of increasing pressures on input costs, especially for commodities and related raw materials, most of which it imports. On May 26 Bloomberg reported that April factory-gate inflation of 6.8% (vs. April 2020) could have been worse if many Chinese industrial companies had tried to pass along their higher input costs. Bloomberg called this stance an “inflation cushion in global value chains.”
In general, Chinese “upstream” companies (those closer to the actual production) have been able to maintain higher profit margins than “downstream” firms (those closer to consumers). The smaller downstream companies, which typically face more competition, have seen their margins squeezed further. Will this relative containment of inflation be unleashed upon the rest of the world at some point? Are inflationary pressures even greater than we realize? If 2011 is a guide, they certainly are. Ten years ago, inflation in raw materials had been at about 10% for 21 months, while the average export prices of washing machines, microwaves, and air conditioners rose 11.7%. In contrast, last month raw materials prices were 15.2% higher than in April 2020, but export prices of those same home appliances were up only 5.5% from the previous year.
Are these distortions? According to Citi Research’s May 27 report, the recent trends were confirmed when China released its industrial profits data: Although revenues were flat in April vs. March, profits continued to expand, especially for upstream companies.
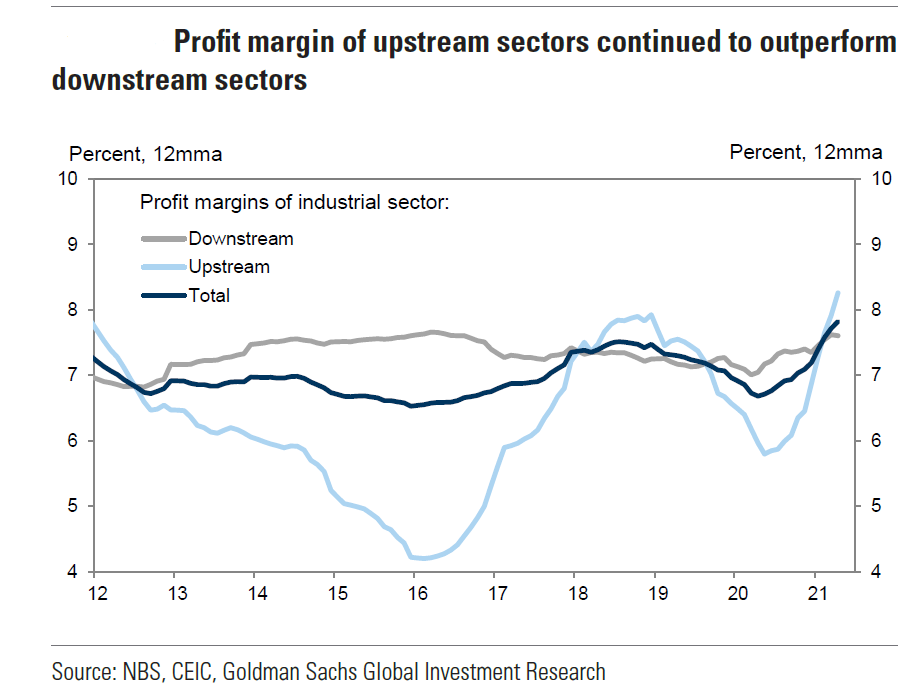
Goldman Sachs – China: Industrial profits rebounded sequentially in April – 05/27/2021
CapEx uncorked
It appears that the speed of this economic recovery has made top company executives more optimistic: With shortages staring them in the face as strong demand seems to only increase, many have boosted their capital expenditure (CapEx) plans significantly. In its latest review of 750 publicly traded nonfinancial companies, Citibank found that 2021 CapEx plans were expected to rise by 7.9% in March (vs. the prior year), up from 5.9% in February. Some budgets, led by the consumer discretionary sector, are projected to exceed 2019 levels by 10%. In particular, the IT sector is now expected to see a 21% jump vs. a 4.3% decline in 2020.
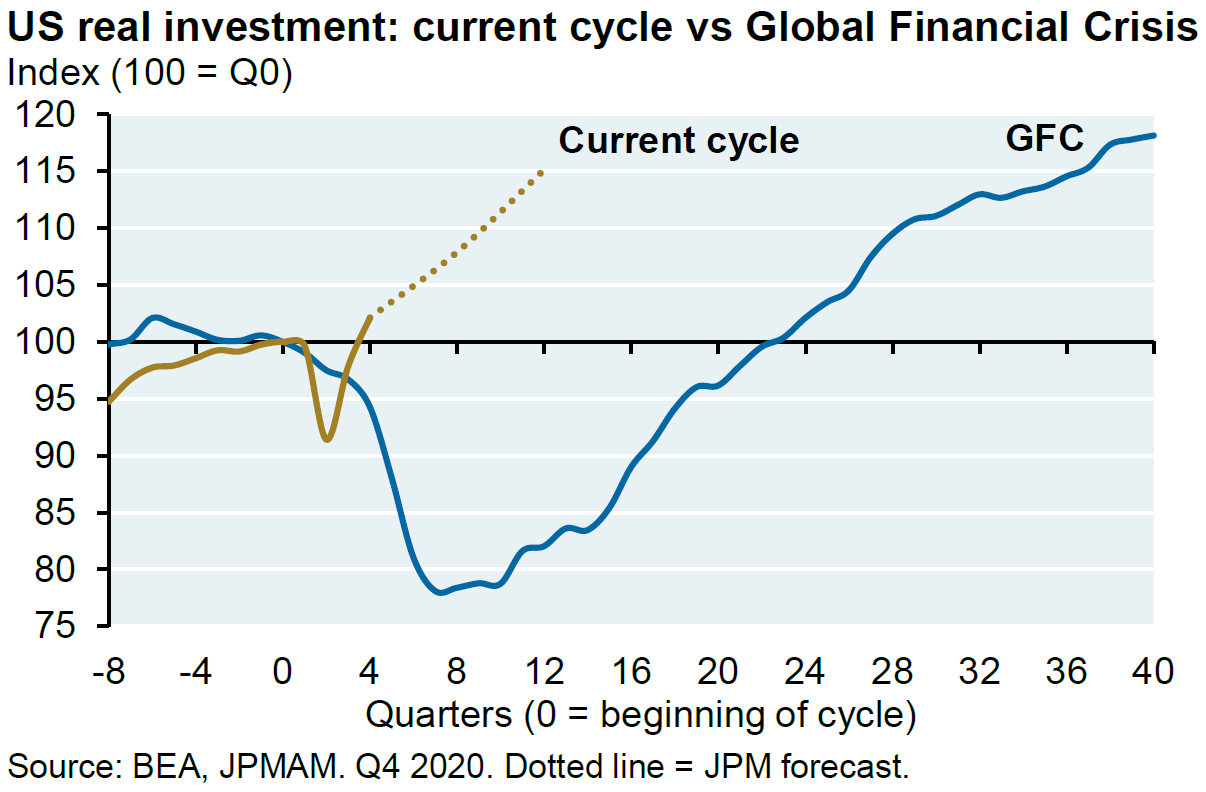
As we have noted previously, lending standards were recently lowered for construction and industrials companies. This should further boost Purchasing Managers’ Index (PMI) economic activity levels, which typically lead bond yields by three months. Indeed, CapEx was very slow to respond after the Great Financial Crisis of 2008. Not this time. Everything now is sped up—and ample liquidity ($5.4 trillion in global excess savings) only greases the wheels.
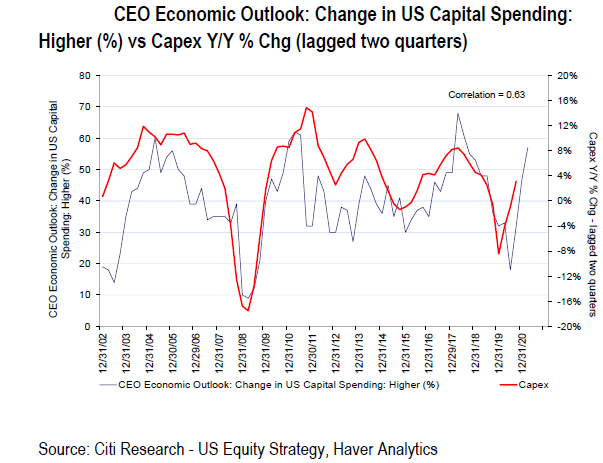
Citi – Monday Morning Musings The Continued Capex Comeback – 05/21/2021
JP Morgan – EYE ON THE MARKET – 05/24/2021
JP Morgan – Business Cycle Has Legs, Revising EPS Higher, Style Positioning and Extreme Correlations – 05/21/2021
A shift in the S&P?
Value/cyclical stocks still dominated the ranks of the S&P 500’s best performing sectors in May. Even so, lately there seems to have been a progression to more defensive and predictable growth stocks. A gradual shift seems to have begun in the second week of May, when top performing sectors tilted slightly toward cyclicals/value but less so than the previous week. Last week was also mixed but with a more “defensive” tilt. This week’s first two days saw defensive sectors emerge, and while that course reversed slightly on Wednesday and Thursday—when the U.S. released a lot of positive economic data, including rising prices and difficulty in hiring needed employees, and the 10-year Treasury yield finally reacted accordingly, up to 1.61%— through Thursday, the communication services sector was still the best performing sector for the week, but the overall sector performance of the S&P 500 was more mixed.
The general trend seems to be shifting away from cyclicals/value as the best-performing sectors, but with unpredictable and variable daily fluctuations along the way. Thus we suggest that equity investors consider taking advantage of these fluctuations to add to big-cap, high-quality growth stocks and to have a more foreign equity exposure as well, at least for the short (and maybe intermediate) term. Active managers who carefully scrutinize and are very selective with stocks should be able to outperform passive managers in the current environment.
Bottom line
The enormous complexities of the world’s economies have only increased as they have become more interconnected. Globalization has been a deflationary force for many years—but the pandemic has accelerated de-globalization, which could make inflation more persistent. The sheer speed of the economic recoveries has made the rebounds uneven, making it harder to discern the timing—let alone sustainability—of trends. Day-to-day volatility and more pronounced sector rotation only add to underlying uncertainty about what investments an optimal portfolio should comprise. We believe it is prudent to consider more foreign exposure to take advantage of the rolling economic re-openings around the world.
The economic effects of other complexities exposed by the pandemic are not as obvious, but they’re coming. These include great inequalities—for example, the accessibility and distribution (or lack thereof) of COVID-19 vaccines underscore the variability of the world’s healthcare systems. Although the pandemic has accelerated de-globalization, it has also shown that, like it or not, we are increasingly connected through our health and climate concerns. The worse the inequalities, the more potential for negative repercussions. Does anyone really know what the many complexities are, let alone understand what their interrelationships mean? We remain skeptical. A little humility may be in order.
Want to receive our weekly summary straight to your inbox? Subscribe here!
IMPORTANT DISCLOSURES
The views and opinions included in these materials belong to their author and do not necessarily reflect the views and opinions of NewEdge Capital Group, LLC.
This information is general in nature and has been prepared solely for informational and educational purposes and does not constitute an offer or a recommendation to buy or sell any particular security or to adopt any specific investment strategy.
NewEdge and its affiliates do not render advice on legal, tax and/or tax accounting matters. You should consult your personal tax and/or legal advisor to learn about any potential tax or other implications that may result from acting on a particular recommendation.
The trademarks and service marks contained herein are the property of their respective owners. Unless otherwise specifically indicated, all information with respect to any third party not affiliated with NewEdge has been provided by, and is the sole responsibility of, such third party and has not been independently verified by NewEdge, its affiliates or any other independent third party. No representation is given with respect to its accuracy or completeness, and such information and opinions may change without notice.
Investing involves risk, including possible loss of principal. Past performance is no guarantee of future results.
Any forward-looking statements or forecasts are based on assumptions and actual results are expected to vary from any such statements or forecasts. No assurance can be given that investment objectives or target returns will be achieved. Future returns may be higher or lower than the estimates presented herein.
An investment cannot be made directly in an index. Indices are unmanaged and have no fees or expenses. You can obtain information about many indices online at a variety of sources including: https://www.sec.gov/fast-answers/answersindiceshtm.html or http://www.nasdaq.com/reference/index-descriptions.aspx.
All data is subject to change without notice.
© 2021 NewEdge Capital Group, LLC


