
Weekly Summary: October 11 – 15, 2021
Key Observations:
- Strong shelter components were a sign of inflation being more persistent, while the decline of more transitory components of CPI, such as airfares, is expected to reverse in the coming months.
- The goods component of the U.S. PPI experienced a solid increase while the services component was less robust. The services segment was probably affected by Delta variant concerns, which are now greatly diminished.
- China’s PPI continued to surge in September, which raised stagflation concerns, as well as concerns that China’s exporting of inflation and supply disruptions could get “worse.”
- A flattening yield curve highlights economic growth concerns.
- The minutes of FOMC’s September meeting confirmed many of our views.
The Upshot: We believe that the inflationary pressures on goods pricing will continue as supply chains remain constrained. It is too early to assume that we have seen the peak in supply constraints and disruptions. A generally colder-than-normal winter would greatly influence supply chains, economic growth rates and inflation. We remain agnostic on this issue. Our expectation is that investors’ sentiment will flip on their assessment of this issue under the “right” circumstances. We would then expect volatility to increase. Furthermore, we view the weakness of many core CPI and PPI key components as “transitory.” These weak components were mostly services-related and were affected negatively by Delta variant concerns. The services measures should improve with the dissipation of coronavirus infections. We anticipate that stock selectivity will continue to be important as Q3 earnings season unfolds and as the focus on margins and pricing power intensifies.
Shelter Increases – More Persistent CPI
To paraphrase the lyrics from The Rolling Stone’s “Gimme Shelter” song, the very strong shelter costs components of the U.S. September Consumer Price Index (CPI) increases the probability that inflation will be more persistent and less likely to “fade away.” Tenants’ rent measures increased 0.45% m/m and owners’ equivalent rent (OER) measures increased 0.43% m/m. These were the biggest monthly increases since 2001 and 2006, respectively.
Shelter costs are generally considered to be more persistent types of inflation and are included in core (ex food and energy costs) CPI calculations. September core CPI was roughly in line with consensus expectations. However, headline CPI, which includes food and energy costs, was higher than expected in September. In its October 13 report, Citi Research (Citi) indicated that it expects shelter price increases in the 0.3% -0.4% range into next year. Core CPI was held down by weakness in its more “transitory” components such as airfares, apparel and used car prices. We were encouraged by the underlying components of September’s CPI figures that U.S. inflation will be more persistent and higher than many investors expect. Please see below for more detailed data.

Source, Citi: US Economics: Stronger details of core CPI as upside risks to shelter materialize (10/13/2021)
U.S. PPI
Although the U.S. September Producer Price Index (PPI) was somewhat weaker than expected, the headline year over year increase set a new record. Approximately 80% of the headline PPI gains in September were attributable to demand for goods which increased 1.3% m/m compared to the 0.2% m/m rise for services. Just as with the U.S. CPI, the dramatic decline in the prices paid for airline passenger services held back the services component of PPI. We consider this drop in airfares to be “transitory.” The drop in airfares will also affect the Fed’s preferred measure of inflation, Personal Consumption Expenditures (PCE). Citi estimated on October 14 that the PPI decline in airfares would translate into a 0.13% drag on core September PCE inflation.
Source, Citi: US Economics: Drop in airfares in PPI to weigh on PCE inflation (10/14/2021)
China PPI – Exporting Inflation
China’s record setting pace of PPI increases in September continued to reflect supply chain disruptions and cuts in production due to high energy prices and shortages, which even led frequently to power outages. The surging price of coal mining was a very big part of PPI increases. Citi also noted on October 14 that the “power outages and producer cuts drove up prices of energy-intensive products significantly.” The continued increases in PPI should continue to make investors consider stagflation risks. As we have highlighted in previous commentaries, China should continue to be an exporter of inflation. It is all but inevitable that China’s supply chain disruptions will affect global supply chains as well. Moreover, given China’s dramatic slowdown in its population growth, we don’t expect China to be a source of “cheap” labor.
China PPI-CPI Gap, Protecting the Consumer
The gap between China’s CPI and PPI continued to widen in September. The Chinese authorities are trying to hamper the rise in prices paid by consumers. An example of this is that China’s National Development and Reform Commission (NDRC) lifted curbs on coal-fired electricity prices, but “pledged to keep utility costs stable for households.” (Citi, October 14 report). We think it’s too early to accept the notion — as many investors appear to believe — that we have seen already the peak of supply chain disruptions. We remain agnostic on this topic. As our last weekly commentary outlined, winter temperatures will be critical in this determination.
Source, Citi: China Economics: Record-High PPI Inflation Raises Stagflation Risk (10/14/2021)
FOMC Minutes – Inflation Upside Risks, Economic Growth Slowdown Risks
The Federal Open Market Committee (FOMC) minutes of their September 21-22 meeting seem to support our current assessment of inflation. The FOMC staff continued to judge that the risks to their inflation projections were “tilted to the upside with the possibility of more severe and persistent supply issues viewed as especially salient.” This would then “risk that longer-run inflation expectations would move appreciably higher and lead to persistently elevated inflation.” In line with our characterization of the weaker-than-expected September U.S. nonfarm payrolls data announced last week, the minutes also agreed that “labor supply constraints were the main impediments to further improvement in labor market conditions rather than lack of demand.” Moreover, the minutes substantiated our view that more monetary accommodation would not address such constraints. Furthermore, FOMC’s minutes also confirmed our expectation expressed in last week’s commentary that the Fed could begin tapering its asset purchase program as early as mid-November.
Finally, the minutes shared our concern that economic growth rates “were skewed to the downside,” and that the future course of the pandemic would most likely be the source of such downside risks.
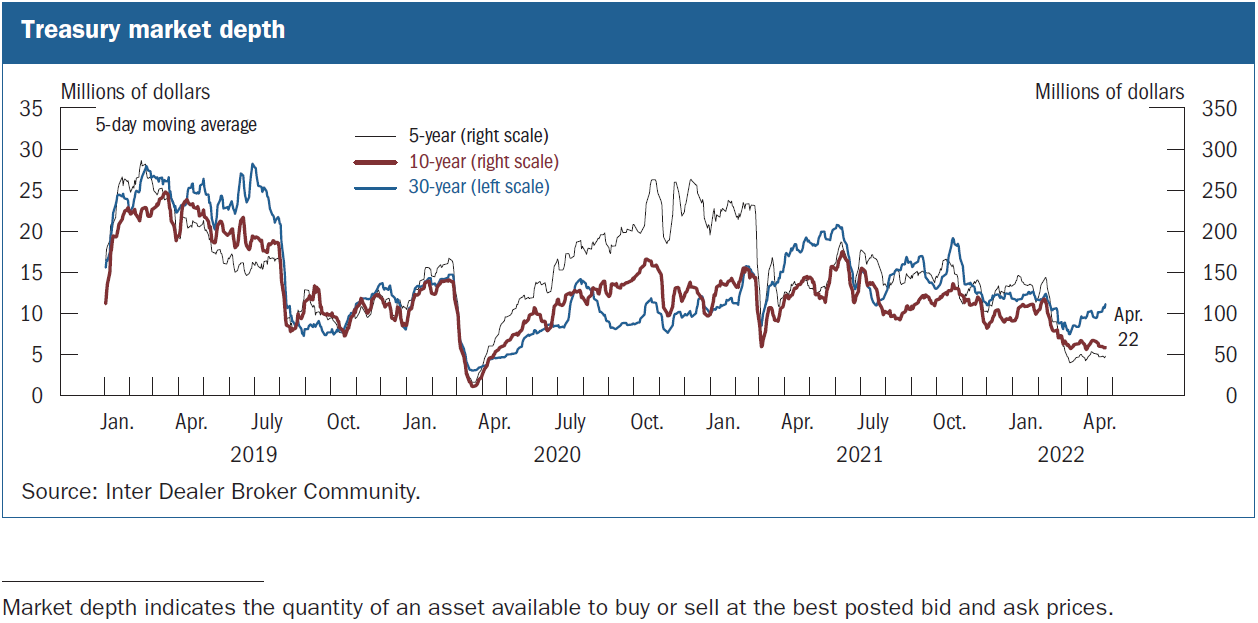
Flattening Yield Curve
In summary, the latest FOMC minutes seem to corroborate our views that, at least in the short run, economic growth rates will remain skewed to the downside and that inflation rates will remain skewed to the upside. The first two trading days of the bond market this week — Monday was closed for a holiday — appeared to focus on the possibility of slower economic growth. The dramatic flattening of the Treasury yield curve during these two days was illustrative of this view. In fact, According to a J.P. Morgan (JPM) October 12 report, on the first bond trading day this week, the “curve saw its largest one day flattening in nearly three months.” The flattening continued the following day. Yield curves flatten when longer duration yields trade lower relative to the movement of shorter duration yields. Most investors interpret a flattening yield curve as an indication of less optimism about economic growth rates. But why the sudden change in the yield curve? We are not aware of any fundamentals change in our assumptions about economic growth rates and inflation from last week to this week. Perhaps the trigger was a “weak” 3-year Treasury auction and a much more successful 10-year Treasury auction on Tuesday. Weak auctions tend to push yields higher and successful auctions tend to push yields lower. Alternatively, “positioning” might have also played a role — too many bond shorts in longer duration Treasuries. As has often been the case this year, changes in market sentiment, can abruptly change trading patterns. We maintain our view that longer-dated maturities will soon resume their ascent, but that this ascent will be sporadic. Our focus remains on the 10-year Treasury yield.
Investment Sentiment Shifts
Shifts in investor sentiment also were prominently displayed by U.S. equities. Mid-week, U.S. equities appeared to reverse their recent negative pattern of trading lower in the last hour of trading. This was followed by a dramatic rise in U.S equities the following day, which saw all 11 S&P 500 sectors positive. The composition of this week’s best performing sectors was very variable on a daily basis.
Banks Begin 3Q Earnings Season – More Idiosyncratic Selection
Many major U.S. banks started the Q3 earnings reporting season this week. So far, they all beat both earnings and revenues estimates. But their stock price reactions differed widely. Bank of America, Morgan Stanley and Goldman Sachs performed best. Given the generally high U.S. equity valuations, the daily shifts in S&P sector performance this week and investors apparent ability to distinguish between these bank stocks, it is our belief that this more idiosyncratic performance of individual stocks will persist at least in the short term. It is our belief that selective, individual stock selection will become increasingly important at least in the short-run. Another example of how important selectivity can be is comparing the stock performance of Amazon and Alphabet (Google) this year. As of this week, GOOGL stock has appreciated roughly 60% while AMZN is positive by roughly only 1%. Conversely, there were many months in 2020 when AMZN greatly outperformed GOOGL.
Margins, Pricing Power and Stock Selectivity
We have been concerned over 3Q margins since 2Q reports. Financials, including banks, have obviously not been affected by supply chain disruptions and constraints, except perhaps by their ability to hire and retain qualified workers at “reasonable” compensation levels. But many companies will continue to be affected by supply chain disruptions and shortages, input prices, their own pricing power, wages, their ability to hire qualified employees, availability and pricing of needed materials and commodities, and certainly the ability to avoid margin compression – a narrowing of input costs and pricing power. In such an environment, companies with pricing power should flourish.
Counting Words and Phrases
There is little doubt that investors and analysts will be counting how many times certain words and phrases will be used in earnings-related conference calls and transcripts. These might include supply chain constraints and/or disruptions, inflation, stagflation, pricing power, wages, labor shortages, input prices, shipping costs, etc. Pricing power and maintaining margins should remain a principal focus in evaluating companies and their stock prices. Selectivity will be key. However, as interest rates rise, we still believe that potentially the best risk/reward buying opportunities in the short-to-intermediate term will remain in the Value and Cyclical type stocks. We continue to expect volatility to continue in both directions as sentiment shifts and as many concerns are further clarified and/or resolved.
Bottom Line
We continue to believe that inflation will be higher and more persistent than most analysts and investors predict, especially if we have a colder than normal winter. Globalization has been a powerful deflationary force for decades. Technology advances, including disruptive technologies, generally have accelerated deflationary pressures. China played a very large role in global deflationary tendencies. Given its rapid population growth, China was able to export deflation. Mostly due to its “one child” policy, its population growth has slowed dramatically. China’s government probably waited too long to eliminate that policy. Once people become used to a certain lifestyle, it is difficult to break their habits.
China has now become an exporter of inflation. China’s recent energy shortages and electricity power rationing have worsened supply constraints and disruptions that affect supply chains worldwide. On the margin, these latest developments have decelerated global economic growth and have raised inflationary pressures. Stagflation concerns have been rising in response. China’s newly expressed policy goal of “common prosperity” over the importance of economic growth has exacerbated these tendencies even further.
The severe energy shortages and electricity power rationing now occurring in China have highlighted the tremendous costs needed to develop renewable energy sources. There is now a concerted global effort to strive for zero-carbon emissions energy sources in lieu of fossil fuel powered electricity generation. Even as new technology will reduce the costs of renewables, we are skeptical that those costs would be lower than fossil generation for quite a few years. This might be a case where technological advances will actually add to inflationary pressures in the short to intermediate term. A prime example of this is the high cost of electricity in Germany relative to many other countries as Germany continues to transition to more renewable energy and electricity sources. We expect that such transitions will be expensive, disruptive and inflationary in the near and intermediate terms.
We maintain our view that longer duration interest rates, most notably the 10-year Treasury yield will resume their ascent in the near to intermediate term. As we indicated in our previous weekly report, the USD will likely appreciate in a stagflation environment. Otherwise, we expect a lower USD in a more typical rolling economic expansion, where European and Emerging Market countries would be able to grow their economies relative to the U.S. In such an environment where interest rates are rising, we believe that Value and Cyclical type equities would outperform more Defensive and Growth types of equities in a short to intermediate time frame. International exposure could be then also very attractive. We expect volatility in many markets to continue over similar periods.
Selected Data of Interest
U.S. September CPI: headline CPI +5.4% y/y vs +5.3% y/y for August; core (less food and energy) +4.0% y/y, same as August; headline +0.4% m/m for September vs +0.3% m/m August; new vehicles index +1.3% m/m vs. +1.2% m/m in Aug vs. +8.7% y/y – largest increase since 1980; energy +1.3% m/m, gasoline +1.2%, airlines fares down 6.4% m/m vs down 9.1% m/m in Aug, used cars and trucks down 0.7% vs down 1.5% in Aug, but +24.4% y/y; food at home +1.2% m/m, food away from home +0.5% m/m; lodging prices down 0.6% m/m, car and truck rentals 2.9% lower m/m; tenants’ rent +0.45% m/m, OER +0.43% m/m. Source: Bureau of Labor Statistics (BLS) October 13.
US September PPI: headline PPI +0.5% m/m seasonally adj. vs +0.7% for Aug, vs, 1.0% in July; unadjusted +8.6% y/y, the largest y/y increase since November 2010, when this series first began; +1.3% m/m for “final demand goods” largest rise since +1.5% m/m in May, and final demand services +0.2% m/m; 40% of broad based advance due to +2.8% m/m on energy, final demand foods +2.0% m/m; gasoline +3.9% m/m; prices for airline passenger services fell 16.9% m/m. Source: BLS October 14.
China September PPI and CPI: PPI (factory inflation) +10.7% y/y highest yearly increase since these calculations began in October 1996 vs. +9.5% y/y in Aug., +1.2% m/m vs. +0.7% m/m in August. CPI was +0.7% y/y vs +0.8% y/y in Aug. CPI food prices 0.7% lower m/m in Sept. vs. +0.8% m/m in Aug; non-food CPI +0.2% m/m in Sept vs down 0.1% m/m in Aug. Sources: CNBC, Citi and China’s National Bureau of Statistics (NBS), JPM, all dated October 14. The NBS report on PPI highlighted a notable increase in coal prices on strong demand and tight supply conditions, along with a price rally of high energy-consumption industrial products – including cement, chemical products, ferrous metals and non-ferrous metals.
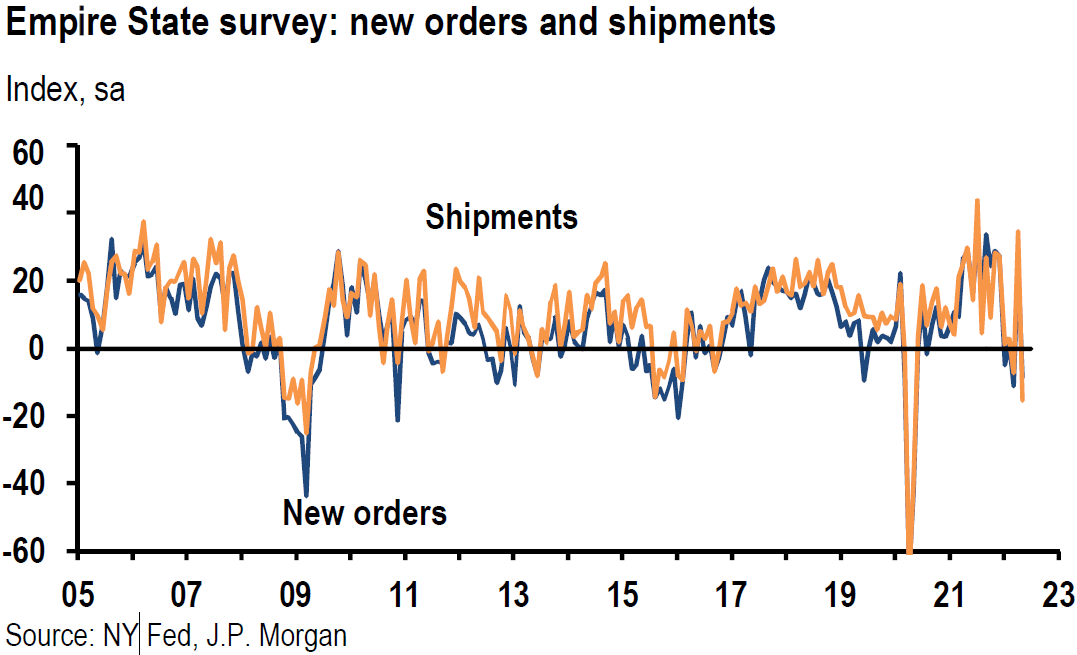
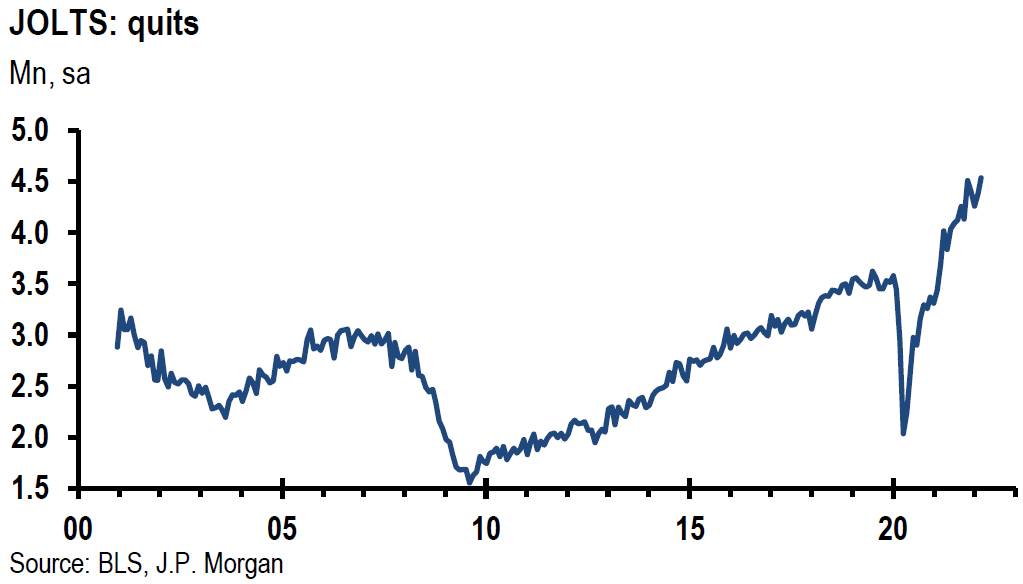
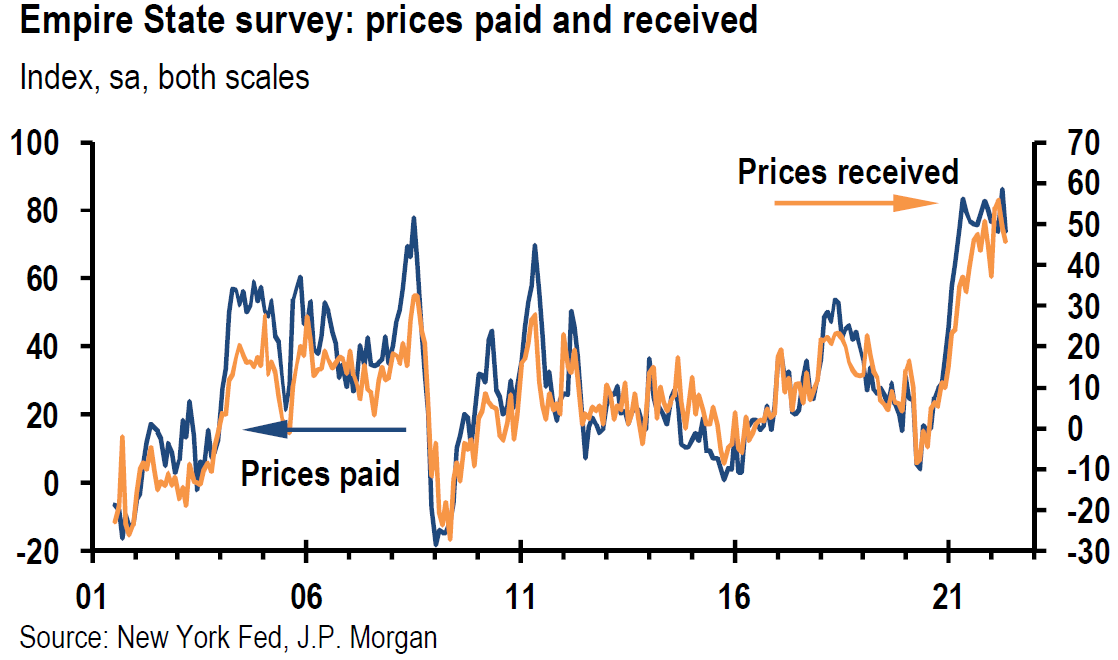
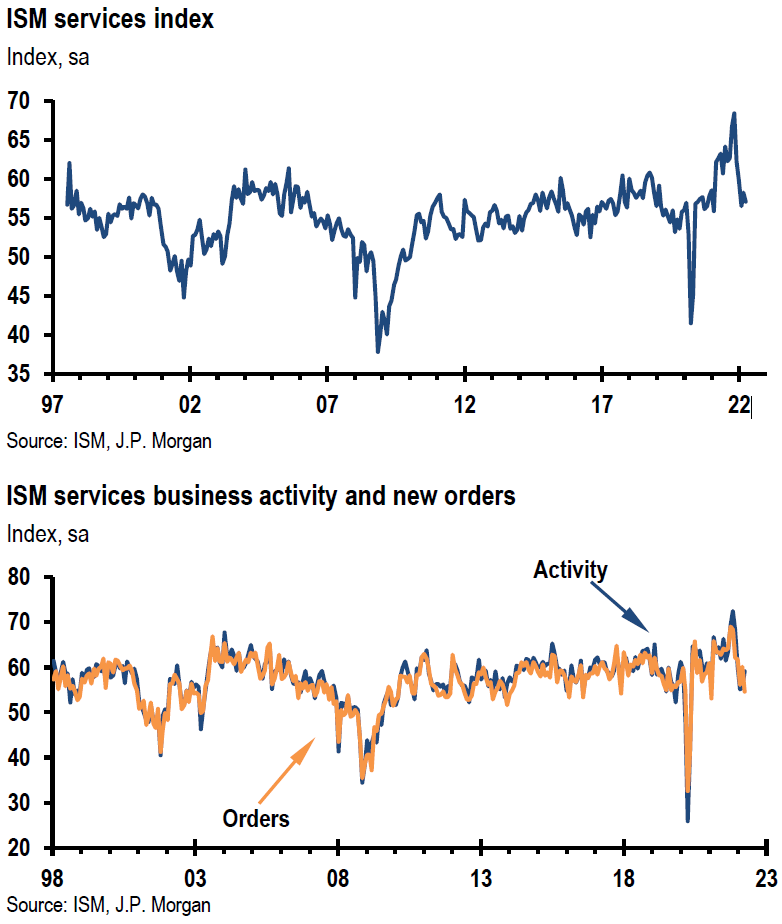
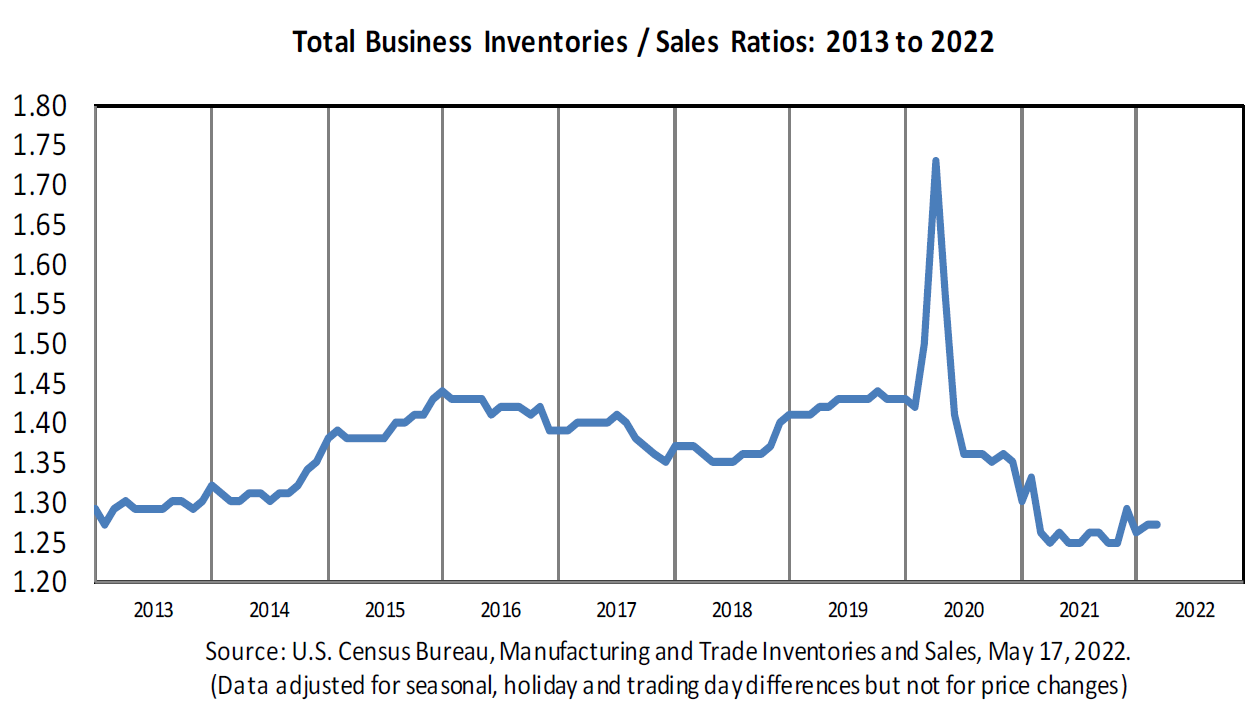
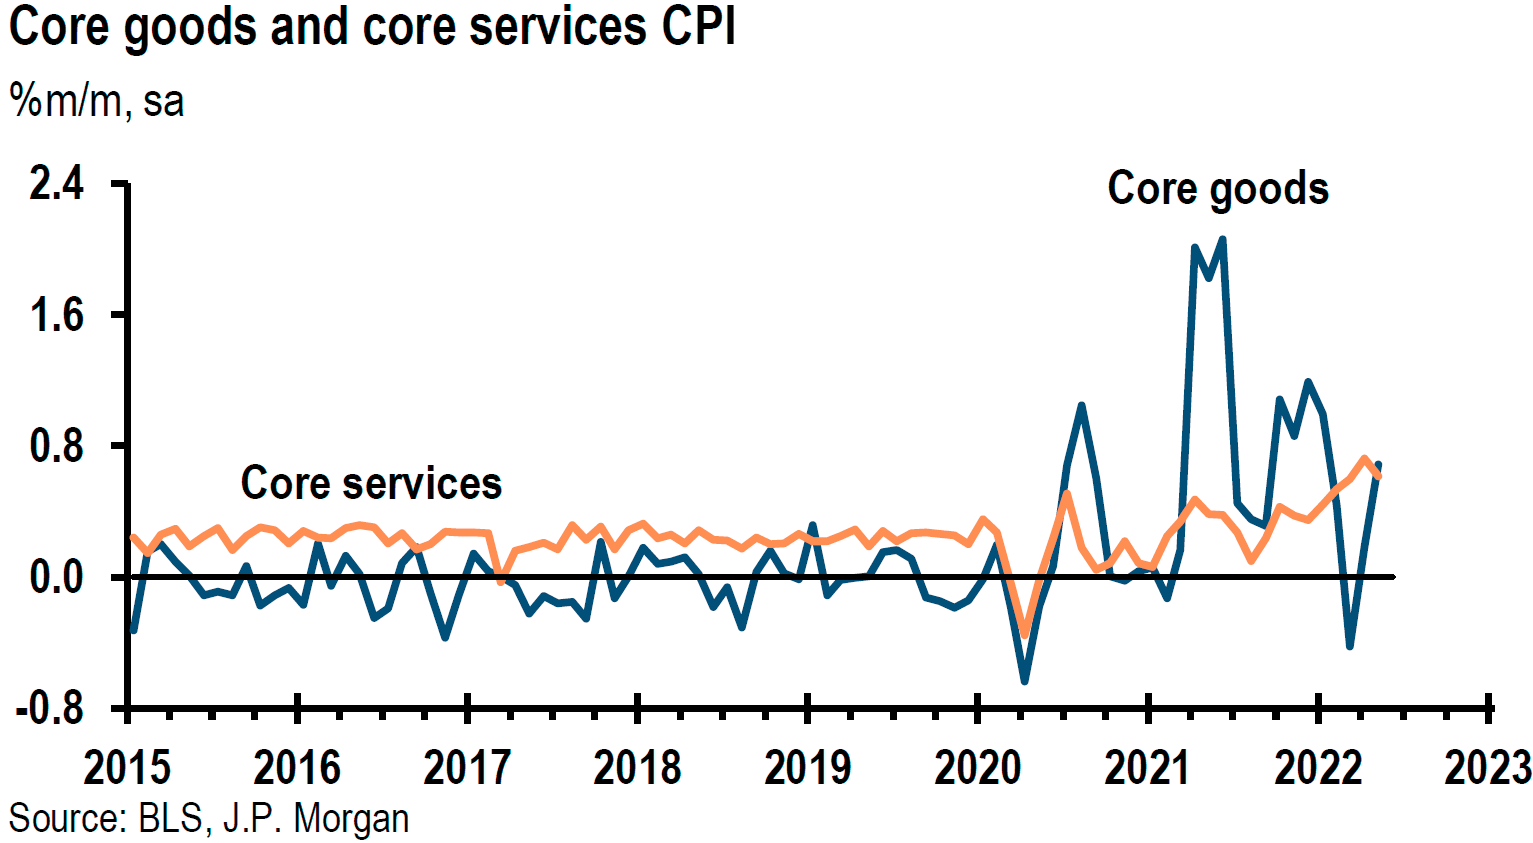
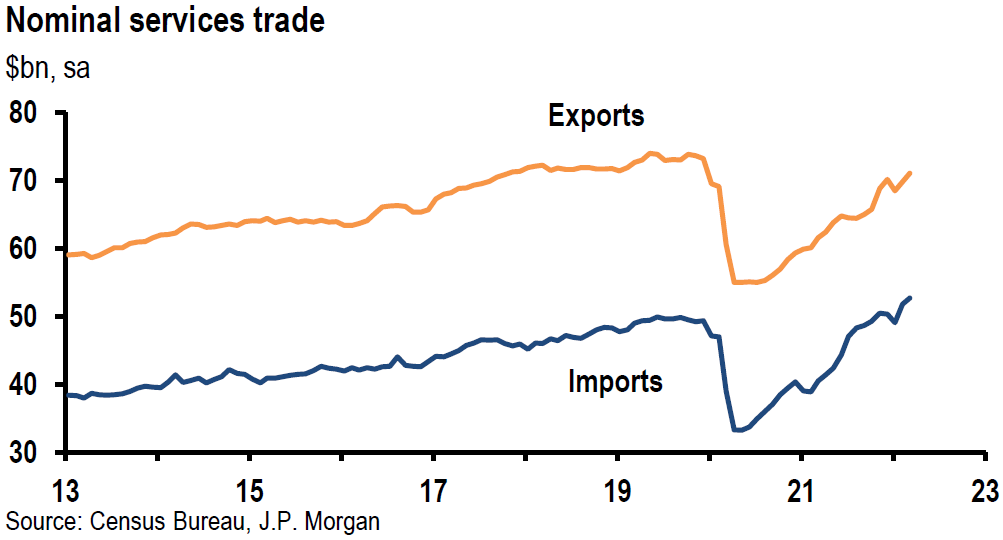
Charts of Interest
Source, J.P. Morgan: GLOBAL MARKET INTELLIGENCE MACRO WEEK AHEAD (10/10/2021)
Source, Goldman Sachs: Global Markets Daily: Macro, Take the Wheel (10/13/2021)
Source, Goldman Sachs: China: CPI Inflation decelerated, while PPI inflation picked up further in September (10/14/2021)
Source, Citi: Winter Energy Price Shock (10/12/2021)
Source, J.P. Morgan: China: September export activity beat expectations again, commodity imports lost some momentum (10/13/2021)
Source, Goldman Sachs: Global Views: From Bottlenecks to Traditional Slowdown (10/12/2021)
INDEX DEFINITIONS
KBW Nasdaq Bank Index (BKX): The KBW Bank Index is designed to track the performance of the leading banks and thrifts that are publicly-traded in the U.S. The Index includes 24 banking stocks representing the large U.S. national money centers, regional banks and thrift institutions.
MSCI EM Value Index: The MSCI Emerging Markets Value Index captures large and mid cap securities exhibiting overall value style characteristics across 27 Emerging Markets (EM) countries.
MSCI EM Index: The MSCI Emerging Markets Index captures large and mid cap representation across 27 Emerging Markets (EM) countries.
NASDAQ: The Nasdaq Composite Index is the market capitalization-weighted index of over 2,500 common equities listed on the Nasdaq stock exchange.
PCE: Personal Consumption Expenditures (PCEs) refers to a measure of imputed household expenditures defined for a period of time.
Russell 1000 Growth: The Russell 1000 Growth Index measures the performance of the large-cap growth segment of the U.S. equity universe. It includes those Russell 1000 companies with higher price-to-book ratios and higher forecasted and historical growth values.
Russell 1000 Value: The Russell 1000 Value Index measures the performance of the large-cap value segment of the U.S. equity universe. It includes those Russell 1000 companies with lower price-to-book ratios and lower expected and historical growth rates.
S&P 500: The S&P 500 Index, or the Standard & Poor’s 500 Index, is a market-capitalization-weighted index of the 500 largest publicly-traded companies in the U.S.
VIX: The VIX Index is a calculation designed to produce a measure of constant, 30-day expected volatility of the U.S. stock market, derived from real-time, mid-quote prices of S&P 500® Index (SPX℠) call and put options.
Z-Score: A Z-score (also called a standard score) gives an idea of how far from the mean a data point is. It is a measure of how many standard deviations below or above the population mean a raw score is.
IMPORTANT DISCLOSURES
The views and opinions included in these materials belong to their author and do not necessarily reflect the views and opinions of NewEdge Capital Group, LLC.
This information is general in nature and has been prepared solely for informational and educational purposes and does not constitute an offer or a recommendation to buy or sell any particular security or to adopt any specific investment strategy.
NewEdge and its affiliates do not render advice on legal, tax and/or tax accounting matters. You should consult your personal tax and/or legal advisor to learn about any potential tax or other implications that may result from acting on a particular recommendation.
The trademarks and service marks contained herein are the property of their respective owners. Unless otherwise specifically indicated, all information with respect to any third party not affiliated with NewEdge has been provided by, and is the sole responsibility of, such third party and has not been independently verified by NewEdge, its affiliates or any other independent third party. No representation is given with respect to its accuracy or completeness, and such information and opinions may change without notice.
Investing involves risk, including possible loss of principal. Past performance is no guarantee of future results.
Any forward-looking statements or forecasts are based on assumptions and actual results are expected to vary from any such statements or forecasts. No assurance can be given that investment objectives or target returns will be achieved. Future returns may be higher or lower than the estimates presented herein.
An investment cannot be made directly in an index. Indices are unmanaged and have no fees or expenses. You can obtain information about many indices online at a variety of sources including: https://www.sec.gov/fast-answers/answersindiceshtm.html or http://www.nasdaq.com/reference/index-descriptions.aspx.
All data is subject to change without notice.
© 2024 NewEdge Capital Group, LLC


