Those of us raised on science fiction movies know the difference between the “hard” and “soft” parts of the genre. Soft sci-fi films, like Jurassic Park or Star Wars, prioritize human emotion over plausibility, which is often what makes them crowd-pleasers. But a quick scan of ten best lists and Oscar nominations in recent years shows that hard sci-fi films like Gravity, The Martian, and Arrival, which make efforts to ground the on-screen science in reality, tend to receive more critical acclaim.
This dichotomy between hard and soft exists with economic data as well. Soft data comes mostly from surveys and is often used to make projections about the economy, while hard data better reflects real activity as it is happening in the moment without much, if any, predictive power.
After years in the doldrums, soft data may be about to improve significantly, given what we know about partisan survey response bias and the outcome of the election. Key soft data metrics like small business and consumer surveys have a history of responding positively to Republican presidential winds. For example, the ISM Manufacturing Purchasing Managers’ Index (PMI), a business survey measuring the health of the U.S. manufacturing sector that serves as popular cyclical barometer, rose sharply in late 2016.
But investors should not be too quick to draw conclusions about where the economy or markets might be headed based on business or consumer sentiment polls. We don’t have to go back very far to find times in which major soft data shifts have failed to predict real activity. Still, as we grope around in the dark for data to inform our 2025 outlook, some light is better than none. We just need to know how to use it.
What is U.S. Data (Hard or Soft) Saying Right Now?
Soft data tends to be flashier and choppier than hard data. There’s also just a lot more of it. Multiple regional Fed business surveys, layers of consumer confidence polls, and a slew of private business sentiment reports litter the economic landscape. High-quality hard data releases do not come as often and are often hotly awaited as a result.
The lines on the chart below of economic surprises move higher as data comes in above consensus and lower if it falls short. A sustained trend means that data in a given sector – or for the entire economy – has been diverging from consensus mostly in one direction. Soft data, shown on the black line, disappointed in the first half of this year but has improved in the second half, adding to the impression that the U.S. economy is outpacing expectations and supporting the ongoing equity and credit market rallies.
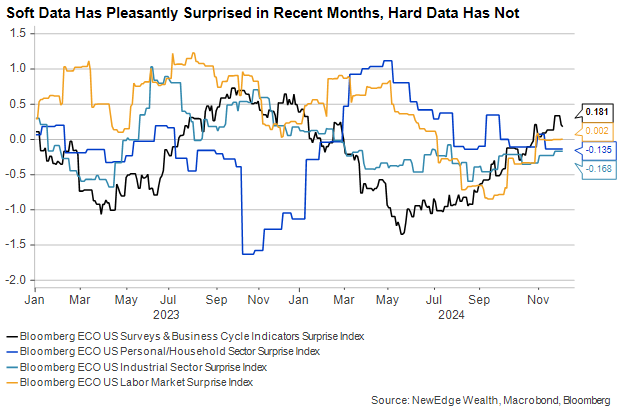
Soft data does not always look stronger than hard data, but it tends to show us trend changes earlier than hard data, as it did, for example, in late 2016. More recently, however, soft data has led many astray. The graph above shows the labor market was surprisingly resilient in early 2023, even when most sentiment surveys were falling. And consumer spending surprised to the upside during the first half of 2024 despite poor confidence indicators.
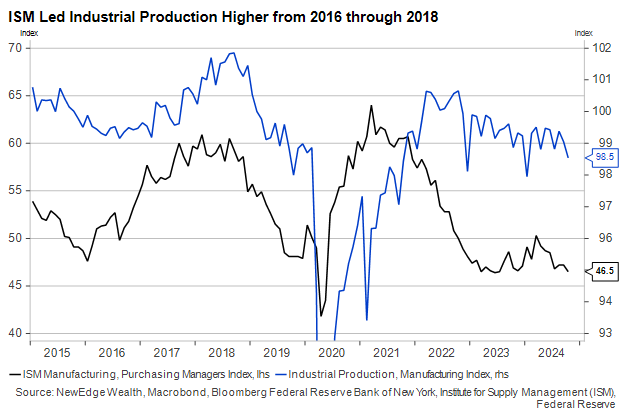
Industrial activity has generally been disappointing this year, but it hasn’t plunged as far as one might have expected, with the ISM Manufacturing PMI above 50 in just one of the past twenty-four months.
Soft Data Could Surge in December
Virtually all the data – hard and soft – we currently have in hand was collected before the election, making this moment a helpful snapshot as we track the reaction to President-elect Trump’s win and his eventual policy agenda. This week, we started to get a trickle of post-election data, starting with some regional manufacturing surveys.
This month’s Empire Manufacturing Index was administered almost entirely after November 5, and its jump from October was one of the largest in the survey’s history. The Philly Fed Survey for current activity did not increase, but sentiment about the future ticked notably higher.
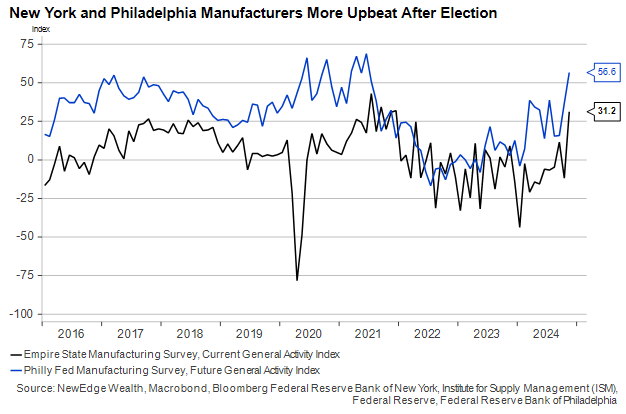
These regional surveys don’t normally move markets, but they may signal more soft data surges are on their way, including the closely watched ISM Manufacturing PMI. This index has been in contraction territory for more than two years, during which time real industrial output has stalled. The November report is due on December 2.
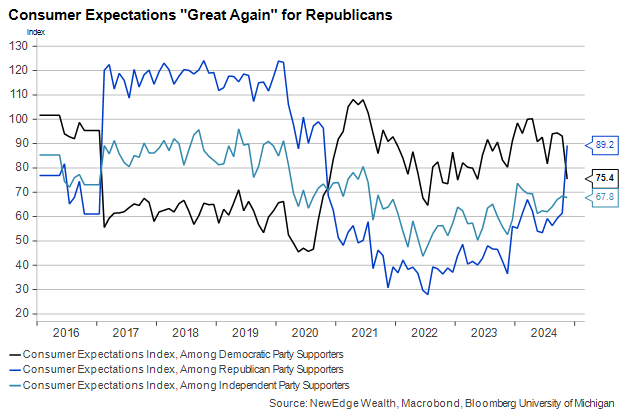
Turning to the consumer, the University of Michigan has published the final version of its November Consumer Sentiment survey, with updated responses from after the election. The revision showed a smaller improvement from October but a large underlying shift in responses along partisan lines similar to 2016 and 2020. Independents have not materially changed their outlook in the past two weeks.
The Limits of Using Survey Data to Make Economic Forecasts
Consumer sentiment can be a useful indicator of where personal spending is headed over the next few months, but it’s less reliable over longer periods. Following Trump’s 2016 win, the University of Michigan Sentiment Index rose overall as Republican optimism outweighed Democrat pessimism. Consumer spending growth accelerated in 2017 following this sentiment surge, but both soft and hard consumer data worsened in 2018, thanks partly to tariffs and the prolonged government shutdown.
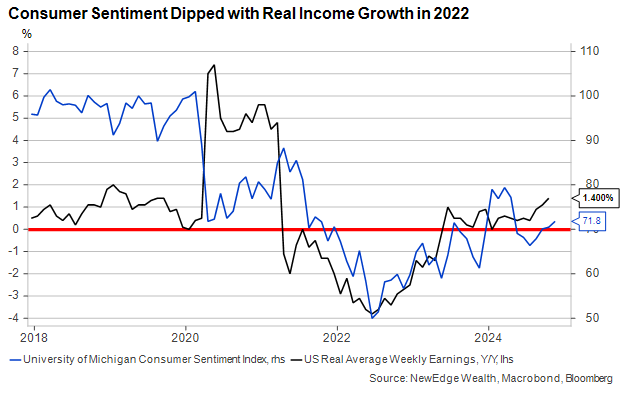
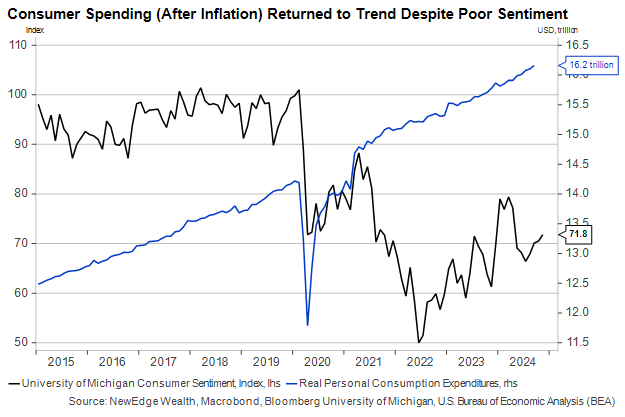
In more recent years, consumer polls have struggled to provide accurate reads on coming changes to consumer behavior. Sentiment hit one of its lowest levels on record in mid-2022, paradoxically during a period of strong real spending growth.
As the charts below indicate, the stated consumer pessimism of the past few years may have been due to the drop in real incomes resulting from the inflation surge. However, as inflation has subsided and real income growth has turned durably positive again, consumer sentiment has recovered but remains far worse than its pre-2020 level.
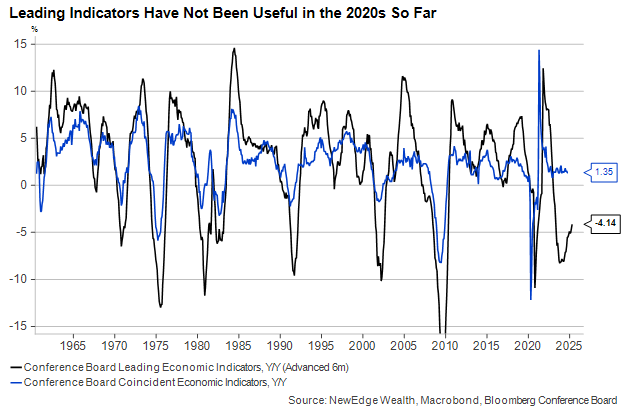
Perhaps no series has better illustrated the futility of using soft data to project economic activity in the 2020s than the Conference Board’s Leading Economic Indicators Index. This basket of indicators has been around for decades and has a good track record of predicting changes in GDP, payroll growth, and industrial production with about a six-month lead time.
But this ability seems to have vanished since the 2020 COVID pandemic. Many economists relied on surveys of self-professed miserable consumers or pessimistic business owners in 2022 to confidently predict a recession in 2023, only to see robust economic growth persist.
Of course, not all leading indicators are opinion surveys. Financial markets themselves do a reasonably good job of forecasting economic developments. Corporate credit spreads, the slope of the yield curve, and the S&P 500 Index are all members of the Conference Board’s index. Of course, markets are not always internally consistent or foolproof, as anyone who based recession calls off the inverted yield curve of 2022-2024 is painfully aware.
Yield curve aside, most market-based indicators are providing reasons for optimism about 2025. Over the summer, we called corporate credit spreads “canaries in a coal mine” for broader markets and the economy. But credit’s continued spread compression since then is an inarguable sign that markets still believe there is a considerable clean runway ahead for the economy in 2025. They won’t always be right, but more often than not, they are.
Conclusion
While markets have been shaky over the past two weeks, the positive trends remain broadly similar to those in the final two months of 2016. Stocks could muster another lurch higher if business sentiment begins to reflect a more bullish outlook for 2025, perhaps due to a combination of lower expected tax rates or less stringent regulation.
It would be unusual for financial markets to turn strongly “risk off” if the ISM survey and its peers roar higher. But as we’ve seen in just the past few years, sentiment is not a perfect stand-in for the economy. Improving vibes can reverse quickly based on geopolitical events, government dysfunction, or, worst of all, a sharp deterioration in key economic data like payroll growth. The latter will be our next big macro barometer when the November employment report hits on December 6.
IMPORTANT DISCLOSURES
The views and opinions included in these materials belong to their author and do not necessarily reflect the views and opinions of NewEdge Capital Group, LLC.
This information is general in nature and has been prepared solely for informational and educational purposes and does not constitute an offer or a recommendation to buy or sell any particular security or to adopt any specific investment strategy.
NewEdge and its affiliates do not render advice on legal, tax and/or tax accounting matters. You should consult your personal tax and/or legal advisor to learn about any potential tax or other implications that may result from acting on a particular recommendation.
The trademarks and service marks contained herein are the property of their respective owners. Unless otherwise specifically indicated, all information with respect to any third party not affiliated with NewEdge has been provided by, and is the sole responsibility of, such third party and has not been independently verified by NewEdge, its affiliates or any other independent third party. No representation is given with respect to its accuracy or completeness, and such information and opinions may change without notice.
Investing involves risk, including possible loss of principal. Past performance is no guarantee of future results.
Any forward-looking statements or forecasts are based on assumptions and actual results are expected to vary from any such statements or forecasts. No assurance can be given that investment objectives or target returns will be achieved. Future returns may be higher or lower than the estimates presented herein.
An investment cannot be made directly in an index. Indices are unmanaged and have no fees or expenses. You can obtain information about many indices online at a variety of sources including: https://www.sec.gov/answers/indices.htm.
All data is subject to change without notice.
© 2025 NewEdge Capital Group, LLC


