
Weekly Summary: June 14 – 18, 2021
It looks like inflation matters after all—at least for one day. After its June 16 meeting, the Federal Reserve’s rhetoric turned much more hawkish. Explicitly acknowledging the unpredictability and unevenness of the pandemic and its consequences, Fed Chair Jerome Powell said it best: “As the reopening continues, shifts in demand can be large and rapid, and bottlenecks, hiring difficulties, and other constraints could continue to limit how quickly supply can adjust, raising the possibility that inflation could turn out to be higher and more persistent than we expect.”
Sound familiar? Although the Fed set no specific timetable for tapering asset purchases and hiking rates, it let the market know that increased policy flexibility is needed and that a quickened pace of policy tightening is increasingly possible amid its continued optimism about the labor force and its now more heightened concern about inflation. As the possibility of more persistent inflation rises, so does the risk of achieving the Fed’s goal of the lowest possible sustainable unemployment rate. Yet the longer the Fed waits to act, the more the cost of achieving that goal increases: If the economy overheats, and the Fed has to act more aggressively later, a “hard landing” becomes increasingly likely. Remember: One of two key requirements for more persistent inflation is more entrenched expectations for inflation. The other requirement is wage growth, which the Fed both wants and expects. The current combination of many job openings and job security is a good foundation for further wage gains.
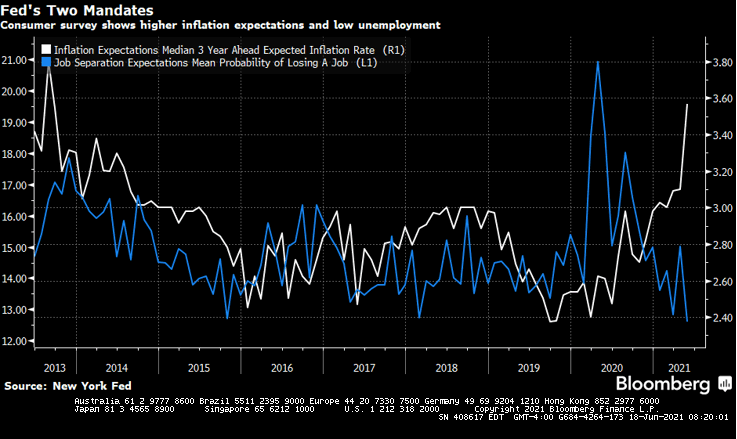
Source: Bloomberg – New York Fed Survey Has Hawkish Message – (6/14/21)
Key observations:
- The Fed appears to have misjudged its tolerance for inflation volatility and the possibility that inflation becomes more persistent.
- The importance of “positioning” and the proper assessment of potential volatility was on full display this week. This was especially true for traders with short positions in Treasuries who were betting on higher interest rates.
- The Treasury yield curve flattened noticeably. In general, this hurts many financials and is considered a sign of less optimism about future economic growth.
- Overall low volatility measures in certain markets, especially for equities, should be re-assessed along with one’s risk tolerance.
- The more that positioning is skewed and one-sided, the greater the potential for volatility.
The upshot: Investors should focus on risk-adjusted rates of return—not just absolute rates of return—and closely examine their ability to withstand and tolerate risk.
Better late than never?
The Fed substantially increased its inflation expectations: Headline personal consumption expenditure (PCE) inflation for 2021 is now projected at 3.4% (up from March’s 2.4% estimate), and core PCE is forecast at 3.0% (up from 2.2%). Estimates for 2022 and 2023 were also raised. The Fed now expects U.S. GDP growth of 7.0% this year, revised upward from 6.5%. The FOMC’s (Fed Open Market Committee) median projection for 4Q 2021 unemployment rate of 4.5% remains unchanged vs. an actual 5.8% for May. The unemployment rate for 4Q 2022 is now projected at 3.8%. The Fed’s so-called “dot plot” indicated two rate hikes sometime in 2023—or two more hikes than were projected in March. (Each Fed meeting participant places a dot on a chart indicating their own economic projections).
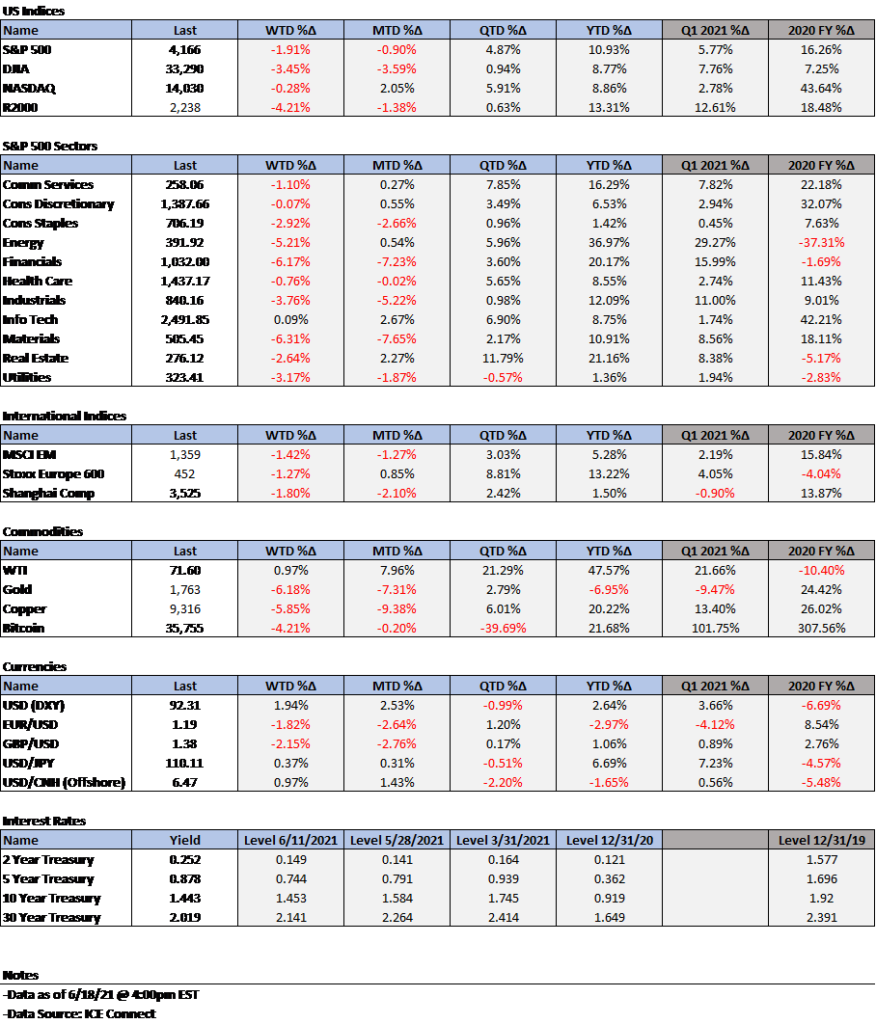
The S&P 500 and Nasdaq initially reacted lower after the Fed meeting by at least 1%. And although they ended down for the day, stocks rebounded when Powell said that the “dots are not a great forecaster of future rate moves” and need to be taken with a “big grain of salt.” The 10-year Treasury yield rose by 8 bps to 1.57% vs. last week’s three-month low of 1.427%, and according to a Goldman Sachs June 16 report, breakeven CPI expectations for the next several years fell by 5-10 bps which implied PCE inflation of about 2%.
Meanwhile, JPMorgan reported yesterday, real yields moved higher. As we have noted, a rise in real yields is generally favorable for the “Value trade.” The U.S. dollar (DXY) was 0.94% higher, the euro and yen decreased by more than 1% and 0.5% respectively vs. the dollar, and spot gold traded 1.84% lower. The only positive S&P 500 sector was consumer discretionary. Financials were next best.
The S&P 500 sector performance for the first 4 trading days this week was heavily skewed in favor of defensive type sectors, with tech best and health care second best. This was in contrast to the first 3 days, when sector performance was rather mixed, with energy as the only positive sector. What a difference a day makes!
The day after
With a day to digest the news from the Fed, USD strengthened by another 0.89% on June 17. The Chinese yuan lost about 0.80% vs. the dollar that day, while the euro dropped another 0.76%, the yen rebounded about 0.4%, spot gold lost over 2%, and copper fell below a two-month low, losing as much as 4% at one point. The 10-year German bund yield rose 9 bps to -0.16% in the morning (EST) before closing at -0.20%. The Bloomberg commodity index was down about 3.5%. WTI and Brent lost over 1.5%.
Among equities, the best performing S&P sectors that day were clearly defensive, with tech leading the way. Nasdaq (up 0.87%) outperformed the other major U.S. stock indexes by far, with the S&P 500 next best, finishing slightly negative.
The 10-year Treasury yield fell as many as 10 bps, to 1.47%, before closing at 1.51%, down 6 bps. Moreover, directly after the Fed’s announcements the Treasury yield curve flattened between the 5- year and longer dated Treasuries. The flattening accelerated the following day. Many of these moves, especially around interest rates, were about positioning and an improper assessment of potential volatilities.
The Fed’s tolerance for inflation volatility
Prior to its June 16 meeting, the Fed could choose to deal with volatile, unpredictable rates of inflation as transitory. It could also assume that wage growth and employment growth were heading in the right direction. All it had to do was to maintain its easy monetary policy for enough time to achieve the desired result.
But price volatility has obviously made the central bank question its assumptions about how transitory or persistent inflation will be. How much volatility can the Fed really tolerate to achieve its true goal of much lower unemployment, which would hopefully lessen inequality? The Fed reiterated that tapering its asset purchase program would not begin “until substantial further progress has been made toward the committee’s maximum employment and price stability goals.”
Investors’ tolerance for market volatility
Investors are faced with the same conundrum: To what extent can they withstand and tolerate volatility in pursuit of favorable returns? One must be cognizant of the difference between “absolute” and “risk-adjusted” returns. According to a Goldman Sachs June 11 report, both realized and implied S&P 500 volatility are at 12-month lows. Yet sector and individual stock volatility is another matter.
Similarly, on June 14 JPMorgan noted a decline in interest rate volatility measures. In fact, they believe that the recent bond rallies (interest rates trending lower) were technical, not fundamental, in nature. Short sellers’ interest in U.S. Treasuries was very broad based. These volatility-sensitive investors were forced to cover their short positions (buy Treasuries) when interest rates started to trend lower. Also, as Citi Research reported on June 11, volatility measures for certain commodities—including energy (WTI and Brent) and base (industrial) metals such as copper, zinc, nickel, and aluminum—rise as an investor’s time horizon increases from three months to a year. (For gold and silver, the opposite is true.)
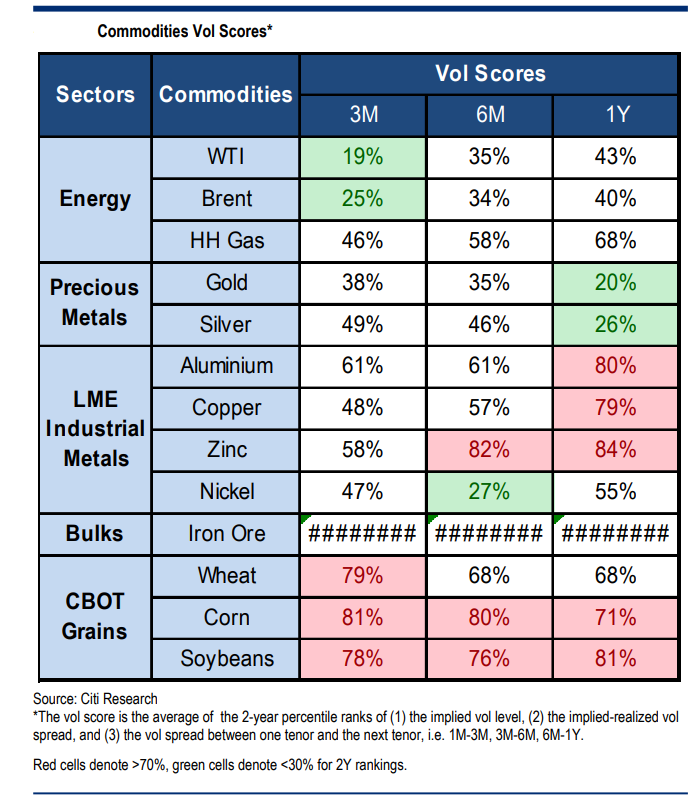
Source: Citi – Commodities Volatility Chartpack Volatility Dashboard: June 11, 2021 – (6/11/21)
Risk-adjusted business
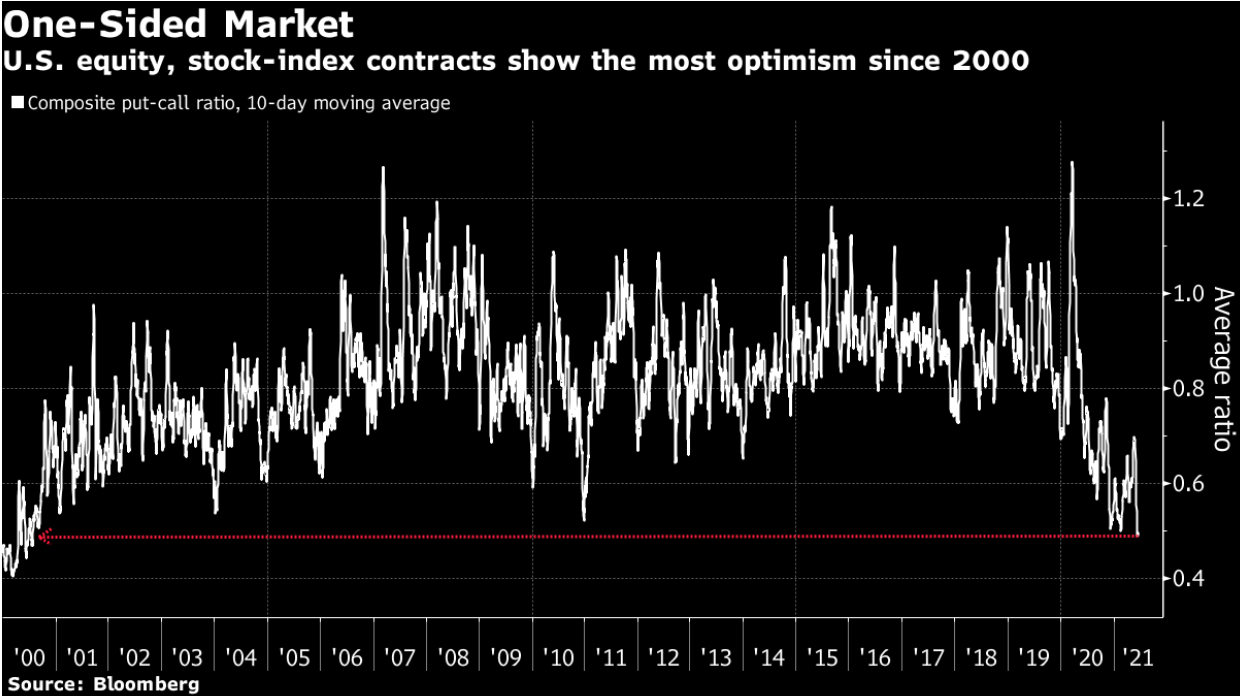
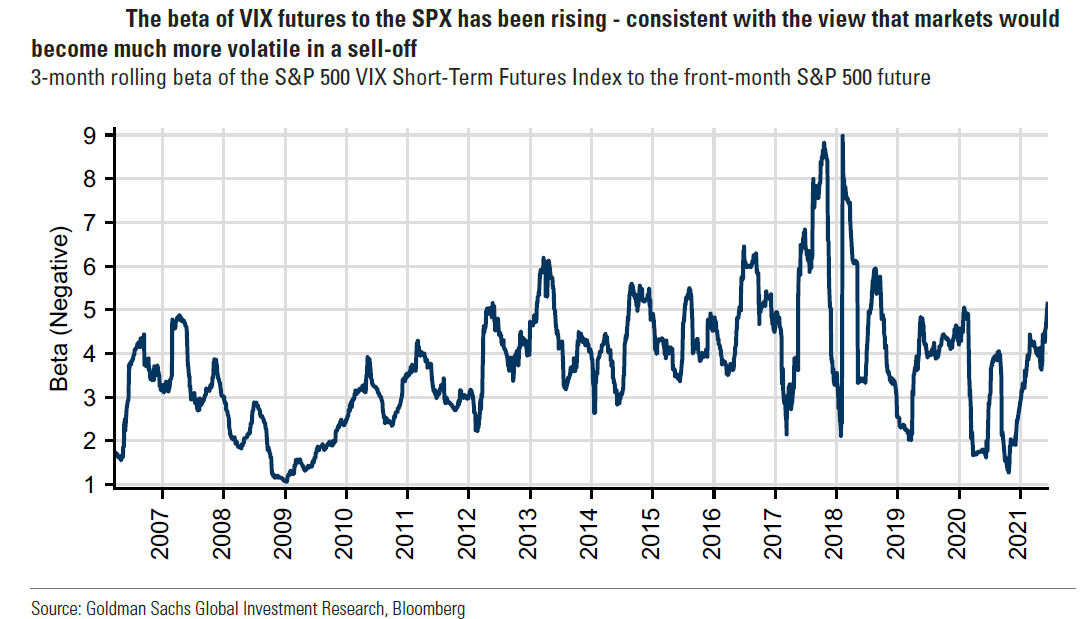
Investors are often most optimistic when volatility measures are low. So, it’s no surprise that U.S. equity and stock index options pricing show the most optimism since 2000. Even when a stock volatility measure (such as the VIX) is very low, it can still be very sensitive to the start of a stock sell-off. This suggests that volatility could increase proportionately in a downturn.
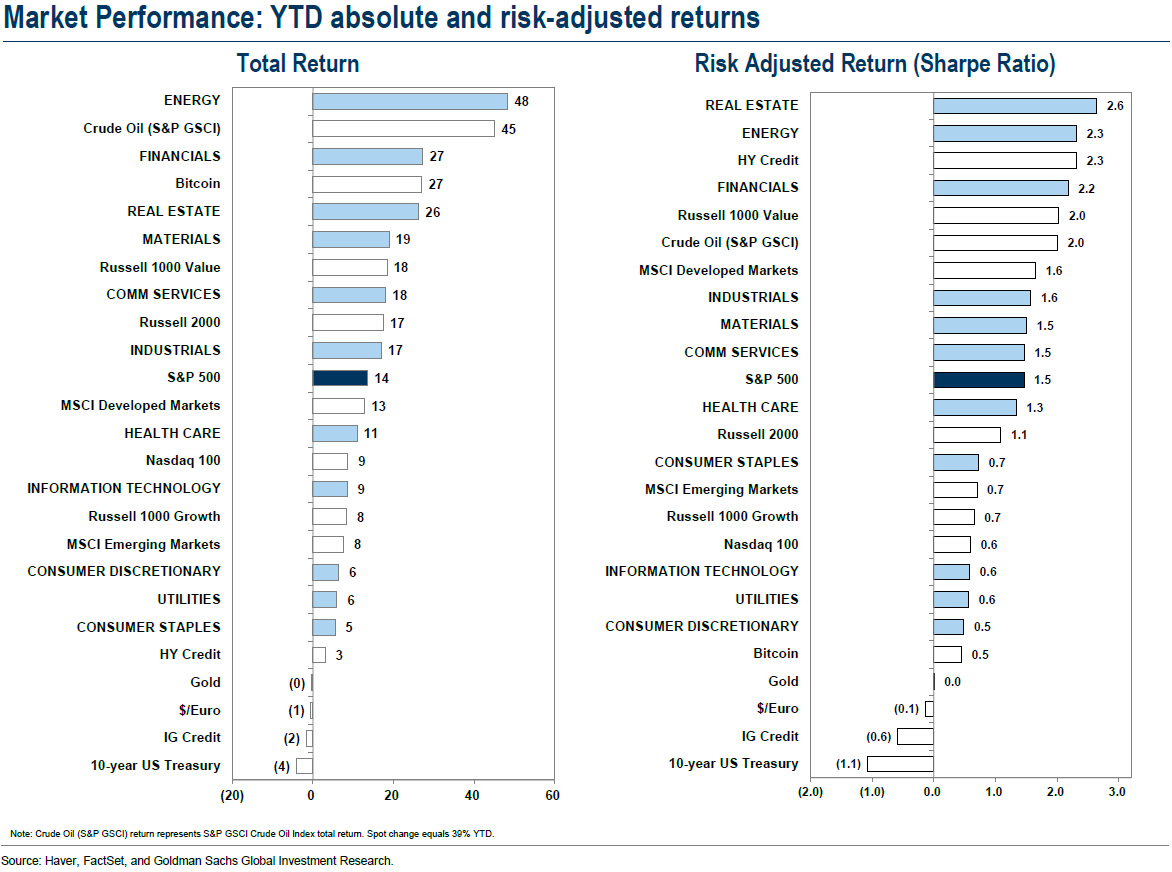
A comparison of absolute and risk-adjusted (considering volatility) returns of various investments might be instructive here. To better understand the point, consider a few extreme differences in an investment’s attractiveness based on its absolute vs. risk-adjusted return: Bitcoin has produced a very attractive absolute return (depending on original purchase price). But on a risk-adjusted basis, it has been much less attractive. Obviously, an investor in Bitcoin must be willing to tolerate a great deal of volatility to obtain a desired rate of return.
At the other side of the, well, coin, an investment in high-yield bonds looks relatively unattractive on an absolute basis—but quite attractive when adjusted for risk. Recent investments in energy, financials, real estate, and Russell 1000 value stocks have ranked high on both metrics. By contrast, Russell 1000 growth stocks ranked lower when considered by either metric, the MSCI Developed Markets index ranked higher in risk-adjusted terms, and MSCI Emerging Markets fared worse by either measure. It all comes down to risk/reward considerations.
Source Bloomberg – Stocks Snap Three-Day Rally; Crude Oil Jumps: Markets Wrap – (6/15/21)
Goldman Sachs – Index Volatility: SPX Volatility Hits COVID-Era Lows Ahead of $2tln Option Expiration – (6/14/21)
Source: Goldman Sachs – US Weekly Kickstart – (6/11/21)
Decisions, decisions…
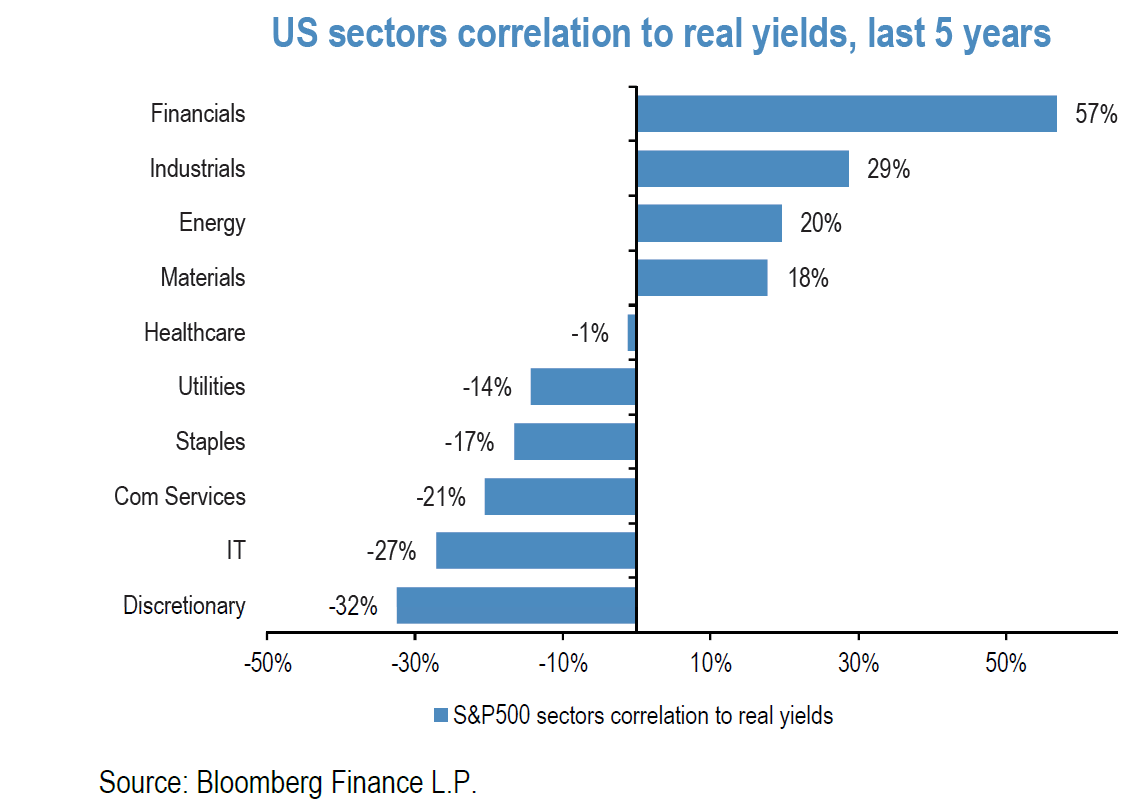
An investor must assess many factors to construct a portfolio with the appropriate expected returns for their own risk profile. Rising real rates have historically favored sectors such as financials, industrials, and energy. A rising U.S. dollar tends to lessen domestic inflationary pressures; while it penalizes foreign revenues, it lessens foreign input costs.
In a June 13 report, Morgan Stanley analyzed the global revenue and input cost exposure of over 1,000 companies it covers. Overall, 29% of those firms derive nearly a third (about 29%) of revenues from foreign sources. Europe (12%) is the largest source, while Asia (excluding Japan and China), China, and Latin America each account for about 4%. As a sector, tech (56%) has the largest foreign exposure, with materials, industrials, and household and personal products also high on the list. After North America, Asia-Pacific is the largest input cost center for U.S. companies, 7% of whom incur more than half their costs in the region, with another 11% incurring 26%–50% of their costs there.
Assumptions about USD are obviously critical in assessing investments in these companies. How much dollar volatility can be expected? This could be the key factor in determining one’s willingness to invest. But maybe such an investment would increase the risk-adjusted returns of an entire portfolio.
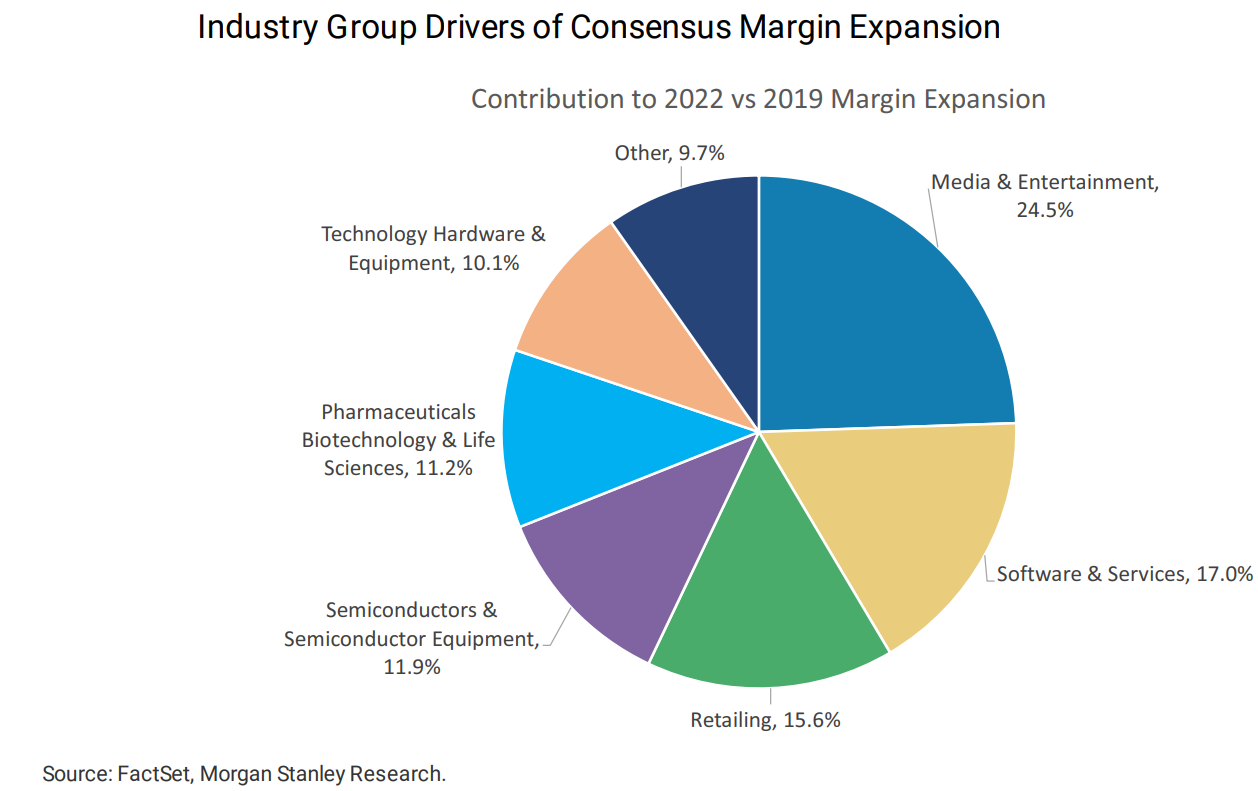
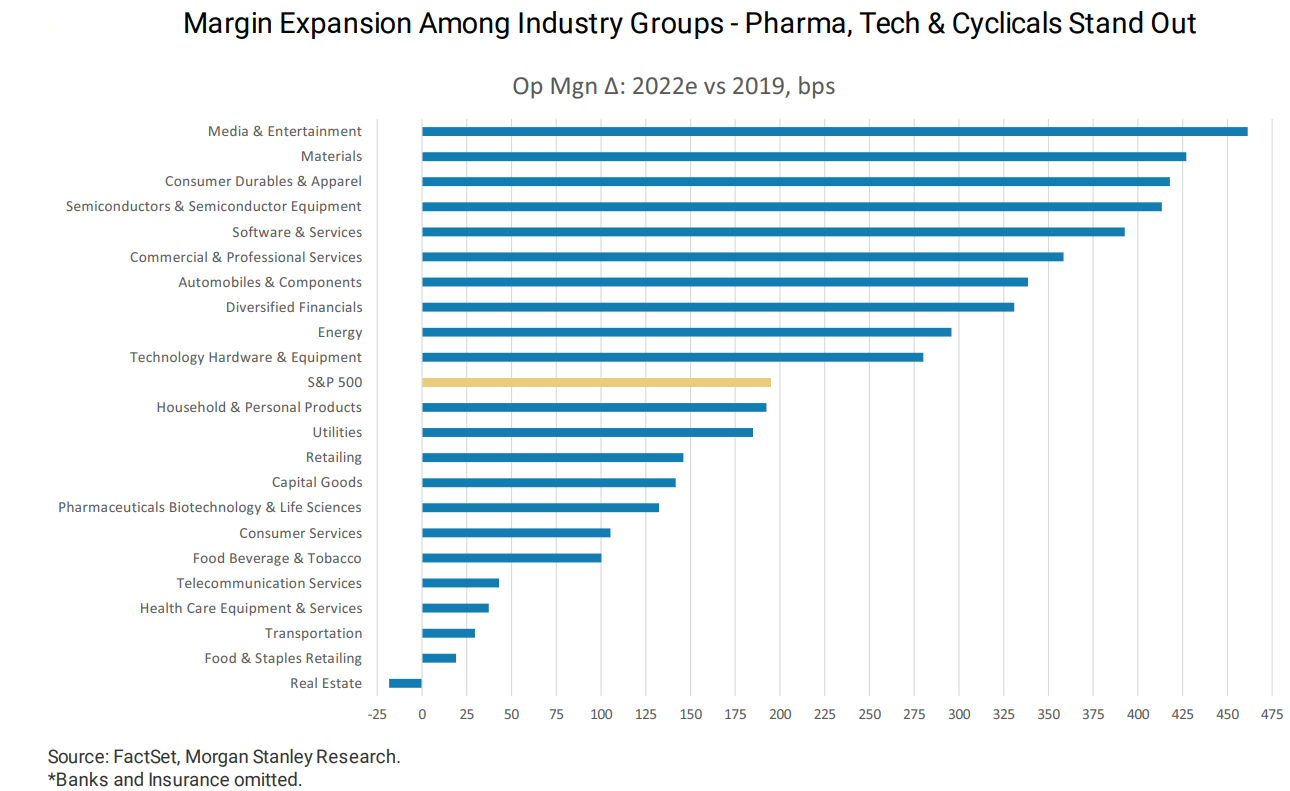
Such factors can greatly affect margin expectations as well. In a June 14 report, Morgan Stanley also examined the industries with the largest expected margin expansion, comparing outlooks for 2022 with those for 2019. On an absolute basis, tech and a few cyclicals were best. Results were fairly similar when adjusted for change of margin expansion relative to company size: Tech dominated again, but now with a mix of cyclicals including financials, energy and materials. (Note that Morgan Stanley includes stocks such as Google and Facebook in the media and entertainment sector.)
Source: J.P.Morgan – Equity Strategy Tapering playbook – (6/14/21)
Source: Morgan Stanley – Weekly Warm-up: Peak Rate of Change on Growth and Inflation? – (6/14/21)
Source: Morgan Stanley – Weekly Warm-up: Peak Rate of Change on Growth and Inflation? – (6/14/21)
Digging into the data
At this point it might be helpful to review what the recent economic (including inflation) data show us—and to consider expectations among various groups of people. The pandemic’s uneven and unpredictable recovery path was on full display again this week. For example, although U.S. May retail sales, as reported by the Commerce Department, were down 1.3% from April (vs. an expected drop of 0.8%), retail sales for the prior two months were revised substantially higher.
Moreover, much of the decline reflects the ongoing shift of consumers toward spending more on services than goods as the U.S. economy reopens. (Purchases of goods dominate the retail report, as the only service category sales it includes are attributable to restaurants and bars.) Lower auto dealer receipts due to low inventories was another notable feature.
Producer prices related to consumer goods again rose more than expected. According to a June 15 Citi Research report, producer price increases have recently led CPI prices by a few months. But retail sales goods spending remains 20% above pre-pandemic levels, as U.S. households now have excess savings equaling over 10% of GDP. Citi further noted that all elements of the retail report pointed to sustained consumer demand.
The business end of the numbers
A similar pattern of healthy (if slower) growth for business activity and higher prices emerged from the Federal Reserve Bank of N.Y.’s Empire State Manufacturing survey. Among the highlights of the survey were that firms remained optimistic that business conditions would improve over the next six months and that the index for future employment hit a record high. Unfilled orders rose, delivery times lengthened at a record pace, inventories were lower and both input and output prices continued to rise sharply.
As released by the Fed this week, industrial production rose 0.8% from April to May (vs. an expected 0.6% gain) on the heels of an downward revision (0.1%, from 0.7%) in April’s month-over-month level. Manufacturing production rose by 0.9% (0.5% excluding motor vehicles and parts). And although capacity utilization grew by 0.6% in May to 75.2%, it remains 4.4% below its long-run average (1972–2020). Cost pressures appear to have hurt the U.S. housing market, driving the June index published by NAHB (National Association of Home Builders) to its lowest level in 10 months. Home builder confidence also hit its lowest level since August 2020, driven by rising costs and supply chain issues.
It also appears that concerns and uncertainties about inflation, finding qualified workers, and wage pressures have similarly affected many small business owners. The gap between small business optimism and their six-month outlook is its widest ever.
Increasing prices are also a feature of the global economy. This week the U.S. Bureau of Labor Statistics reported that import prices rose a better-than-expected 1.1% in May vs. April. Industrial supply prices were especially strong—and export prices were even stronger, up 2.2% month over month. Finally, although the Philadelphia Fed manufacturing index edged down as expected, the six-months-ahead business conditions index jumped to its best level since 1991, and prices paid were the highest since 1979.
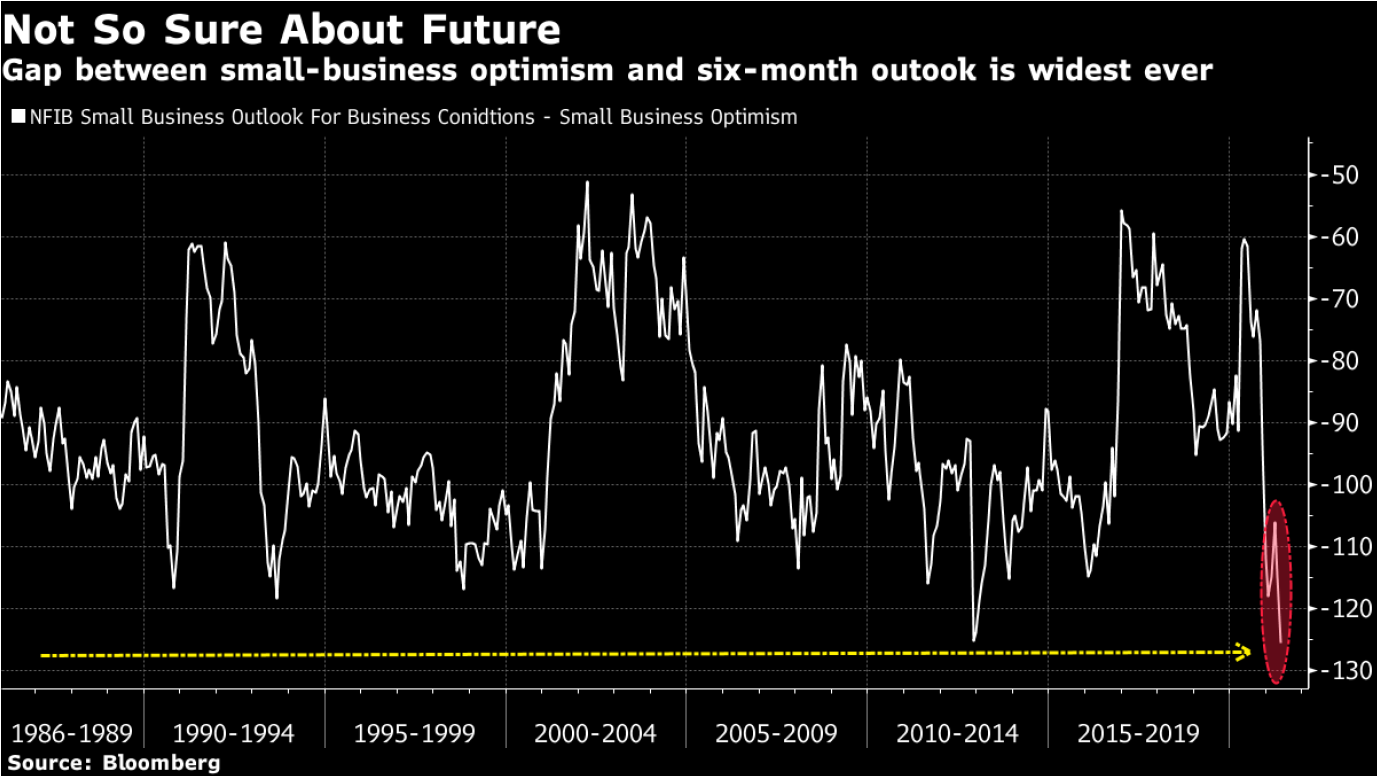
Source: Bloomberg – Souring Outlook for Second Half Pens in Small Caps: Taking Stock – (6/14/21)
Consumers expect higher prices too
Given these economic data, it’s not surprising that surveys continue to show relatively high inflation expectations among consumers. On June 14 The Wall Street Journal reported that in the N.Y. Fed’s latest consumer survey, year-ahead expectations for inflation increased to 4% in May—the highest since the survey began in 2012—vs. 3.4% in April. Similarly, looking three years ahead inflation expectations rose to an eight-year high 3.6%, up from 3.1% in April. Meanwhile, the most recent University of Michigan surveys had similar (if falling) results: one-year inflation expectations of 4.0% (down from 4.6% in April) and three-year expectations at 2.8%, down from 3.0%. When it comes to inflation, these are the metrics that concern the Fed most.
Does market leadership exist?
Clearly, trying to decipher which sectors, companies, and asset classes will perform best has become increasingly difficult. Daily volatility among assets seems to be more variable. Market leaders are hard to predict when economic growth, inflation, interest rates, and currencies have become so volatile even while overall volatility—especially for the S&P 500—has become muted. In a June 14 report, “Leadership in the New Cycle,” Goldman Sachs noted thar opportunities for market leadership are becoming more diverse. Distinctions between investing styles, such as Value and Growth are likely to become more blurred. Perhaps more idiosyncratic factors will play a more prominent role. In any case, this will require a more thoughtful and comprehensive analysis of investment opportunities.
Bottom line
In substantially raising its inflation forecasts, the Fed appears to have not only misjudged its tolerance for inflation volatility but also the magnitude of that volatility. The importance of investor positioning and volatility and risk assessment—especially among Treasury “shorts”—were on full display both this week and last. The Treasury yield curve flattened between the 5-year and the 10- and 30-year maturities, as well as between the 10- and 30-year maturities. This is especially troublesome for financials. It also could indicate less optimism for continued economic expansion.
Given positioning effects, it’s difficult to properly assess the durability of a flatter yield curve. Overall low-volatility measures can sometimes mask volatility in individual sectors and companies. Markets characterized by low-volatility measures can show extreme volatility as they breach certain levels.
The advantages of focusing on risk-adjusted rates of return—as opposed to absolute returns—becomes more evident as volatility increases. Diversification that reduces portfolio volatility becomes more appreciated. For its part, at least the Fed knew that inflation would be volatile. Overall low-volatility measures in certain markets indicate that many investors might not be so aware.
IMPORTANT DISCLOSURES
The views and opinions included in these materials belong to their author and do not necessarily reflect the views and opinions of NewEdge Capital Group, LLC.
This information is general in nature and has been prepared solely for informational and educational purposes and does not constitute an offer or a recommendation to buy or sell any particular security or to adopt any specific investment strategy.
NewEdge and its affiliates do not render advice on legal, tax and/or tax accounting matters. You should consult your personal tax and/or legal advisor to learn about any potential tax or other implications that may result from acting on a particular recommendation.
The trademarks and service marks contained herein are the property of their respective owners. Unless otherwise specifically indicated, all information with respect to any third party not affiliated with NewEdge has been provided by, and is the sole responsibility of, such third party and has not been independently verified by NewEdge, its affiliates or any other independent third party. No representation is given with respect to its accuracy or completeness, and such information and opinions may change without notice.
Investing involves risk, including possible loss of principal. Past performance is no guarantee of future results.
Any forward-looking statements or forecasts are based on assumptions and actual results are expected to vary from any such statements or forecasts. No assurance can be given that investment objectives or target returns will be achieved. Future returns may be higher or lower than the estimates presented herein.
An investment cannot be made directly in an index. Indices are unmanaged and have no fees or expenses. You can obtain information about many indices online at a variety of sources including: https://www.sec.gov/fast-answers/answersindiceshtm.html or http://www.nasdaq.com/reference/index-descriptions.aspx.
All data is subject to change without notice.
© 2021 NewEdge Capital Group, LLC


