As equity market indices have delivered remarkably high and steady returns, investment strategies tied to those indexes can play a more important role in portfolios. So-called passive investing has become a $13 trillion powerhouse, transforming the financial landscape. But its rapid ascent has broader implications for market dynamics.
Passive investing aims to replicate the performance of a market index with minimal trading and lower costs, eschewing active security selection, which attempts to adjust portfolio allocations to capitalize on the most attractive opportunities. For many investors, the choice to use passive over active has been an easy one given its lower fees and lower risk of underperformance relative to market indices.
Index investing had another banner year in 2024, with a small number of stocks accounting for an outsized share of the returns. But what happens when the popular trades lose their luster? Should the pendulum shift into a new direction of lower concentration and higher stock dispersion, conditions could improve significantly and quickly for active managers, while index returns may be modest.
In this whitepaper, we analyze the pros and cons of active and passive investing as well as the structural differences among major global equity indices, which make some more ripe for an active approach than others. While passive versus active will remain hotly debated, investors need not view it as a binary choice. In our view, there’s a strong case for both approaches to co-exist in a portfolio.
Executive Summary
- Passive investing has grown into a +$13 trillion industry and has reshaped financial markets, driving a fundamental shift in investment practices.
- Investors should understand the pros and cons of both investment strategies: Active management aims to outperform the market through strategic decision-making but can come with higher costs, inconsistent performance, and tax inefficiencies. In contrast, passive management seeks to replicate the performance of a specific market index, usually at a lower cost, but comes with little to no risk management and the potential for heightened concentration.
- In less efficient markets, such as small/mid-cap and international equities, where benchmark inefficiencies, limited analyst coverage, and lower index concentration active management tends to produce better results, providing opportunities for skilled managers to outperform.
- A hybrid approach combining active and passive strategies allows investors to strive to leverage their respective strengths, adapting to varying market conditions.
The Rise of Passive Investing
Passive investing made its debut in the 1970s, with Vanguard pioneering the first index mutual fund designed to track the S&P 500 Index at a lower cost for retail investors. Vanguard Group’s First Index Investment Trust was introduced in 1976 with an initial asset base of $11.3 million. The fund is now recognized as the Vanguard 500 Index Fund (VFIAX) and has grown to $1.37 trillion in assets under management, making it one of the world’s largest mutual funds.
Over the past several decades, passive investments have experienced significant expansion, particularly
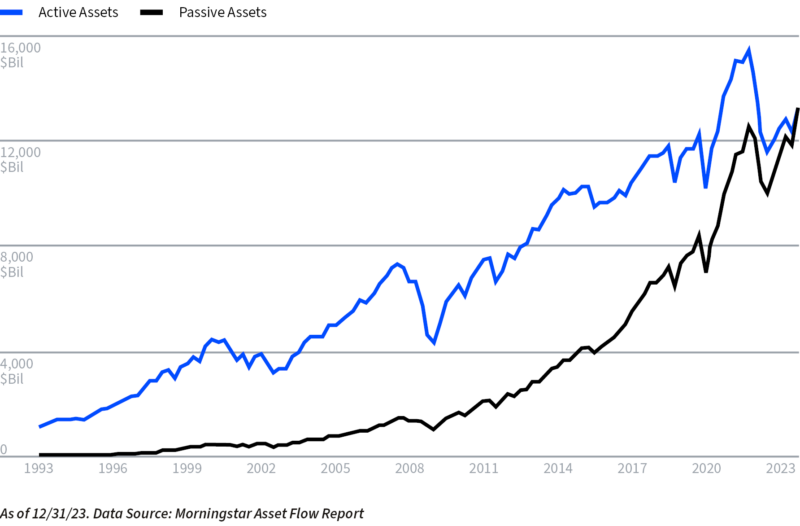
in the aftermath of the 2008 global financial crisis. According to Morningstar’s Asset Flow Report, passive
investments reached $13.29 trillion in 2023, overtaking actively managed funds, which stood at $13.23
trillion at the end of last year (Figure 1).
Figure 1: Passive Investing Tops Actively Managed Funds
In the book Trillions: How a Band of Wall Street Renegades Invented the Index Fund and Changed Finance
Forever, Financial Times journalist Robin Wigglesworth delves into the history of how the largest ETF providers have revolutionized financial markets and influenced investment practices worldwide. He highlights that since
2010, approximately 80% of every dollar invested in U.S. markets has flowed into funds managed by the “Big Three” providers—Vanguard, State Street, and BlackRock. These three giants collectively hold more than a 20% ownership stake in companies listed on the S&P 500.
Today, America’s seven largest companies, by market cap, make up 36% U.S. stock market. The five largest ETFs in the U.S., which have over $2.5 trillion in combined assets, have significant weights to these mega cap companies (Figure 2). The stock market’s primary goal is to allocate capital efficiently to companies that generate the highest return on invested capital (ROIC) or after-tax profit per dollar invested. However, passive investing can disrupt this process by directing funds primarily into the largest companies rather than the most profitable ones.
Figure 2: The Powerhouses Behind the Largest ETFs

Market concentration has not reached these levels since the “Nifty Fifty” bubble of the early 2000s. Although passive funds have now outgrown active funds, with the largest S&P 500 Index ETFs accumulating over $500 billion in assets, these numbers understate the full extent of passive investment. The rapid rise of passive strategies has raised concerns among investors regarding their potential effects on market efficiency, price discovery, and volatility.
Weighing the Trade-Offs: Active vs. Passive Management
Active investing involves allocating capital to funds managed by individuals or teams who actively make investment decisions based on thorough research, analysis, and evaluations. The goal is to achieve returns that exceed those of a benchmark index or the market average. In contrast to passive strategies, active managers have the flexibility to navigate market volatility by adjusting portfolio allocations across sectors, regions, or asset classes, allowing them to potentially mitigate losses and capitalize on opportunities in changing market conditions. Their primary aim is to outperform the market rather than simply track it.

There are several potential downsides to active management. First, the performance of the fund is heavily dependent on the skill of the portfolio manager, meaning poor decisions can adversely impact investor returns. On the other hand, there’s also a risk associated with the loss of a highly skilled manager, commonly referred to as key man risk. Should a portfolio manager leave or become incapacitated, his or her replacement may not possess the same level of expertise, potentially affecting the fund’s performance.
A second notable drawback, and perhaps the biggest one in this debate, is the higher cost structure associated with active management. The higher fees, which cover the resources and expertise involved, place pressure on managers to deliver returns that justify the expense. This pressure can lead to deviations from the fund’s initial investment philosophy, which may, in turn, affect the quality of management.
Lastly, tax implications also play a significant role in the assessment of active management. These can vary based on specific investments in the fund and for how long they were held. Generally, active managers tend to distribute more in capital gains because of the more frequent trading activity generally taking place in their portfolios relative to passive funds, which leads to an increased tax burden for investors compared to passive strategies.
The pros and cons for active management tend to be reversed for passive management – the accessibility and lower cost structure of passive strategies driven by reduced transaction costs and tax efficiency have provided investors with an affordable way to gain market exposure.
Passive investors forego the process of assessing the quality or fundamentals of an individual company and instead attempt to replicate the performance of specific market indexes. As more capital flows into passive strategies, it can artificially inflate the valuations of the largest companies, disrupting traditional market dynamics and diminishing effective price discovery. This shift increases the market’s vulnerability to sharp declines, as passive funds may automatically buy or sell large quantities based on index changes rather than financial health. Many argue that since passive strategies are designed to track a known benchmark, the risk of significant relative underperformance is minimized; however, this does not guarantee strong absolute performance.
As an example, investors who owned the S&P 500 over a 15 period (from 10/31/2009 to 10/31/2024) have made 752.89% cumulative; the same cannot be said for an investor who owned the MSCI Emerging Market Index which has only returned 85.66% cumulative over the same period. Tracking an index can be beneficial as long as the index being tracked isn’t weak and is in an uptrend.
Given that most indices are constructed based on market capitalization and influenced by prevailing market trends, investors in passive investments may inadvertently acquire more concentrated holdings. This lack of diversification can lead to an imbalanced portfolio that is susceptible to market volatility when markets take a turn.
For instance, prior to the bear market of 2000-2002, the technology sector was the largest within the S&P 500 Index. The subsequent burst of the Dotcom Bubble resulted in a 49% decline in the S&P 500 from March 2000 to October 2002. Conversely, value stocks, or non-technology sectors, performed significantly better than their tech-heavy counterparts during this period, with the Russell 1000 Value Index only declining 15%. Similarly, in 1989, Japan constituted approximately 60% of the MSCI EAFE Index, exposing passive investors to significant risk during one of history’s largest market bubbles, leading to a compounded annual return of -2.7% over the following 25 years.1
Michael Green, Chief Strategist at Simplify Asset Management, has expressed concerns about the impact of rapid growth in passive investing on market stability. With the U.S. economy operating near full employment levels, a significant flow of funds has entered 401(k) and retirement accounts, where many investors choose to contribute to target-date or total market funds that merely track indices. While retirement saving is beneficial, this influx of capital into passive investment vehicles has dramatically increased the volume directed into the stock market through these strategies.
Rising to the Challenge: Why Structurally Inefficient Benchmarks Demand Stronger Manager Selection
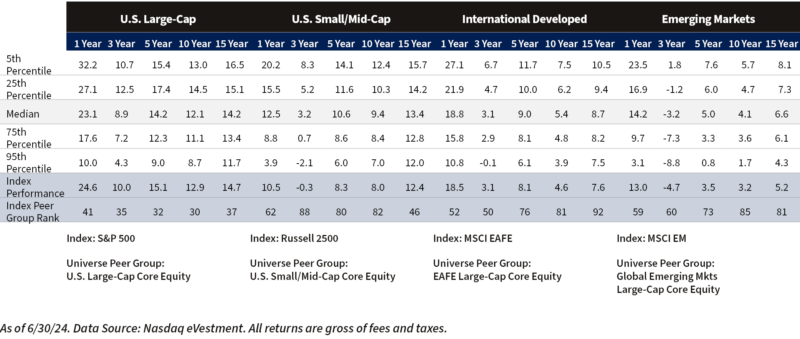
Depending on the asset class and market conditions, active and passive investing each have their own strengths and weaknesses. We utilized data from our research partners to assess the effectiveness of both active and passive management across various equity asset classes and have found that active management is more effective in less efficient markets, such as small/mid-cap and international equities, where opportunities for stock selection and excess returns can be greater. However, in highly efficient markets like U.S. Large-Caps, passive strategies generally outperform passive due to lower costs and greater analysts’ coverage. Figure 3 presents a comparison of standard market-cap-based benchmarks in U.S. Large-Cap, U.S. Small/Mid-Cap, International Developed, and Emerging Markets with their corresponding active manager universes. Historically, when benchmark returns are higher, active managers have more trouble outperforming them. As shown in the index percentile peer ranking, actively managed large-cap strategies struggle significantly more to outperform their benchmarks compared to small/mid-caps and international equities.
Figure 3: eVestment Universe of Active Managers – U.S. Large-Caps vs. U.S. Small/Mid-Caps vs. International Developed vs. Emerging Markets
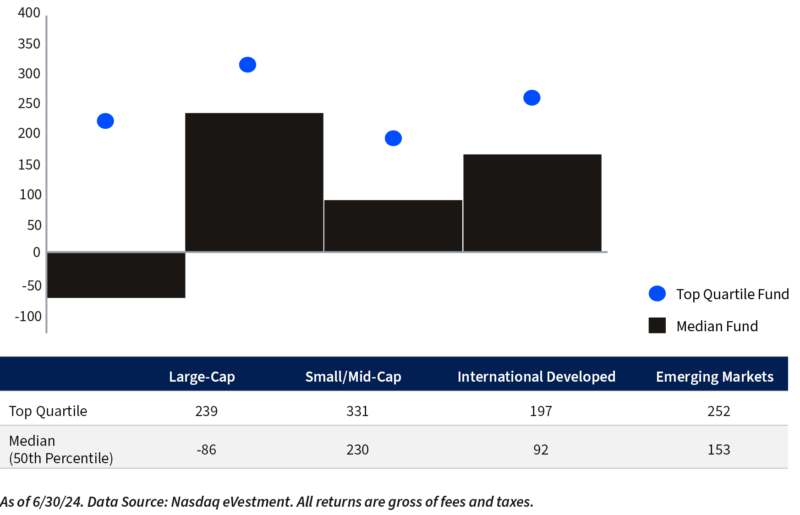
However, selectivity is key, as not all active managers are created equal. Figure 4 analyzes how performance outcomes differ between top-quartile managers (those ranking in the top 25th percentile of their peer group) and “average” managers, defined as the median of their peer group ranking. To highlight why investors should spend time on due diligence, we look at international developed equities in Figure 4. The median international equity manager outperformed their benchmark by 92 basis points on average over the trailing five-year period, while top-quartile managers outperformed their benchmark by 197 basis points, adding an additional 105 basis points in excess returns. This performance gap between average and above-average managers is critical to consider, as it can significantly impact an investor’s ability to achieve their financial goals. Although identifying top-quartile managers can be difficult, the performance differential underscores the importance of conducting thorough due diligence during manager selection.
Figure 4: eVestment Universe of Active Managers Average 5 Years Excess Returns – U.S. Large-Caps vs. U.S. Small/Mid-Caps vs. International Developed vs. Emerging Markets
Where Can Active vs. Passive Be More Effective?
U.S. Equity Markets
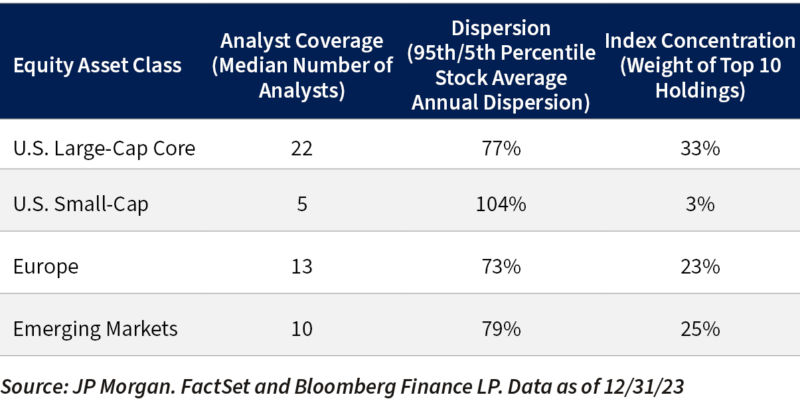
While many factors can influence an active manager’s performance, several factors, such as return dispersions, sell-side research analyst coverage, and index concentration, also play an important role in determining the relative effectiveness of active versus passive management within each asset class.
U.S. Large-Caps
U.S. Large-Caps are the most efficient market within the global equity universe. These companies will exceed $10 billion in market cap and are typically traded in high volumes, which means that there are many buyers and sellers at any given time. This includes industry giants with global footprints, such as Apple, Google, Microsoft, and Walmart, to name a few. With twenty-two analysts covering the average S&P 500 stock and 80% institutional investor ownership, there’s very little room for information asymmetry to create opportunities for active managers to exploit.
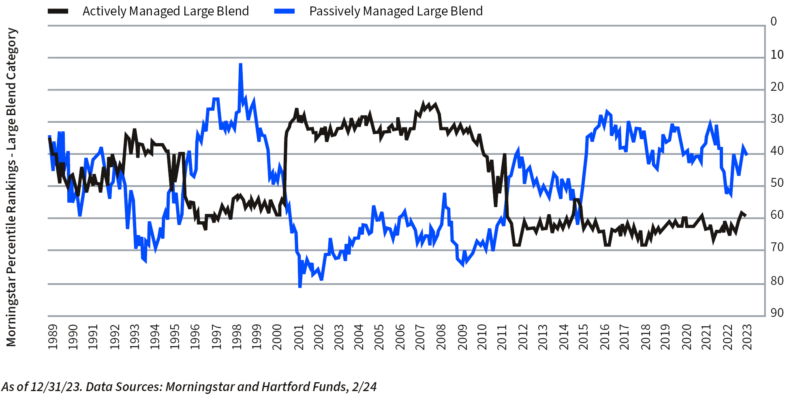
According to Morningstar, for eight consecutive years leading up to 2022 and again in 2023, passive large-blend strategies (tracked by Morningstar’s S&P 500 Tracking Category) outperformed their active counterparts in the Large-Blend Category. This explains the growing popularity of indexing strategies in recent years and throughout 2024, with the dominance of the mega-cap darlings, known as ‘The Magnificent Seven,’ dominating U.S. returns for much of the year.
The S&P Dow Jones published a research report highlighting that historically, active managers have tended to underperform when markets are driven by the largest companies, as they generally maintain stricter guidelines on position weights compared to the capitalization-weighted benchmarks. This challenge has been magnified to a larger degree over the last couple of years as the pronounced concentration within the S&P 500 has continued to grow.
A recent study illustrates this challenge, showing that while more than half of the Morningstar large-blend managers picked stocks that outperformed, 84% still underperformed the Russell 1000 benchmark over a three-year period.2 This shows that despite active managers owning stocks that outperform, having a lower weighting to these names doesn’t offset the dominance of the mega-cap stocks such as NVIDIA, which returned 239% in 2023. As such, picking the right investments and appropriately sizing positions is increasingly difficult in a market where a few large stocks disproportionately drive returns.
However, investors should be cautious of recency bias, the often-mistaken assumption that what has worked over the last couple of years will continue to work in the future. Figure 5 illustrates how active vs. passive large-cap fund performance has moved in cycles. Passive’s last period of sustained outperformance was during the formation of the tech bubble in the late 1990s, a period in which the market was highly concentrated and overcrowded. At the time, the ten largest U.S. stocks carried a 27% weight in the S&P 500. When the tech bubble burst, index concentration fell, creating a favorable environment for active managers to add alpha as performance broadened. Today’s market concentration is the highest it has been in the last 29 years, with the top ten holdings of the S&P 500 Index sitting at 33% of its market capitalization, which may once again set the stage for similar cycles.
Figure 5: U.S. Large-Caps: Passive and Active Move in Cycles
U.S. Small/Mid-Cap
In comparison to U.S. Large-Caps, the U.S. Small/Mid-Cap universe, which is made up of companies that have a market capitalization that ranges between $250 million – $2 billion for small and $2 billion – $10 billion for mid, are considered to be less efficient. Active managers in this space have demonstrated an ability to add value on a consistent basis due to the structural challenges and characteristics that this market segment encounters.
Starting out with the Russell 2500 Index, which tracks the small/mid-cap universe, we see a wide divergence in the quality of companies. Thirty percent of constituents carry high debt levels and fail to generate positive earnings. Many of these companies are thinly covered, with 44% of small/mid-cap stocks receiving no coverage at all and 35% covered by five analysts or fewer. This provides ample opportunities for active managers to uncover undervalued or under-researched investment opportunities.
Smaller-cap indexes also tend to be less concentrated. In the Russell 2500 Index, the top ten holdings account for just 4% of the total index, compared to 33% for the S&P 500. This lower concentration allows active managers to have greater flexibility in stock selection and portfolio weightings, giving them the ability to take larger positions in high-potential companies.
Since 1998, the Russell 2500 Index has consistently ranked below the median among active U.S. small/mid managers over a rolling 5-year return basis.3 This indicates that, on average, active managers have been able to outperform the market, making a compelling argument for investors to employ a skilled manager via a rigorous due diligence process to incorporate into investors’ portfolios.
International Equity Markets
Turning to non-U.S. equities, across both international developed and emerging market equities, the median managers have historically outperformed its benchmark by 109bps and 142bps, respectively, annually over the trailing 15-year period. Top-quartile managers have added between 150 to 350 basis points of excess return over 3-, 5-, 10-, and 15-year periods, suggesting that passive investors could be missing out on significant excess return by not selecting high-performing active managers (Figure 2). This significant dispersion between high-quality and low-quality international stocks highlights the inefficiencies within these global markets.
Due to the lack of transparency, international equities receive less media attention and analyst coverage than their U.S. counterparts. The disparity in analyst coverage is evident when comparing major global markets. For example, 99% of companies within the S&P 500 are covered by three or more analysts, while only 46% of companies in Japan’s Tokyo Stock Price Index (TOPIX) meet the same threshold. This lack of coverage creates similar inefficiencies to those seen in the U.S. small/mid-cap space, offering active managers the opportunity to uncover undervalued stocks.
A key advantage offering active managers a greater opportunity for stock selection and outperformance is the index concentration for non-U.S. indices. Relative to the S&P 500 at 33%, the MSCI EAFE Index and the MSCI Emerging Markets Index only carry a 15% and 25% allocation to the top ten stocks. When indices are less concentrated at the top, there’s more room to discern between winners and losers. Another notable factor is the composition standards of international indices. For example, inclusion in the S&P 500 requires companies to demonstrate “financial viability” through positive earnings. In contrast, the MSCI indices, including the MSCI ACWI Ex-U.S., do not impose such financial viability requirements, allowing both profitable and unprofitable companies to be included, making purely index-based investing less attractive.
In our view, the opportunity set for active management is far larger in international markets than it is in the U.S. Of the world’s more than 55,000 listed companies, 45,000 are outside of the United States. By employing active management within portfolios, investors can uncover local market dynamics, enabling managers to prioritize financially stable companies and exploit under-researched opportunities that are ignored due to a lack of coverage.
A Hybrid Approach to Navigate Market Cycles
This debate of active versus passive has persisted for many years, with no definitive universal agreement on which investment approach provides better results. We believe there is merit in constructing a portfolio that integrates both approaches to harness their respective strengths and adapt to capitalize on evolving macro conditions.
A hybrid approach, balancing active and passive strategies, can offer investors the “best of both worlds” in an always-changing environment. Active strategies have generally delivered greater benefits to investors in specific market environments, while passive strategies have often outperformed in others. For instance, in periods of low dispersion, minimal volatility, and market concentration, passive strategies that closely follow a benchmark tend to perform well. Conversely, during market downturns, top-quartile active managers have historically shown the ability to outperform by mitigating downside risk, leveraging their flexibility to adjust portfolio positioning in a way that passive indexing strategies are constrained.
While bull markets can last some time, market corrections are a feature of equity markets and even a necessary evil to contribute to overall market health. Over the past 34 years, during 28 market corrections, active strategies (as represented by the Morningstar Large Blend Category) outperformed passive strategies (S&P 500 Index) 21 times, with an average outperformance of 109 basis points.4 Both the Nifty Fifty and the tech bubble serve as warning periods of extreme market corrections. Although future market conditions remain unpredictable, understanding when active management can add value versus a passive approach can shape portfolio allocation decisions.
Conclusion
There is no crystal ball to know which way markets will go, and investors should recognize the distinct advantages and limitations of both passive and active management. Looking ahead, we encourage investors to remain aware of the forces that could drive market conditions to shift. Instead of being on one side of the boat between active and passive, a hybrid combination, in our opinion, offers the best approach. As we have identified in this whitepaper, in asset classes such as U.S. small/mid-caps and international markets, which have less analyst coverage, lower market concentration, and greater return dispersion, we see better reasons to use active management. In contrast, within U.S. large-caps, selectivity is key, and leveraging the strengths of index investing to capture broad returns while positioning for potential upside.
At the core of our investment philosophy is a deep commitment to understanding our clients’ goals and objectives, ensuring that we provide tailored strategies designed to deliver long-term success.
Sources
1 Data Source: Pekin Singer Strauss Asset Management. Rathbones Active vs. Passive – The Great Investment Debate. 20 Apr. 2016.
2 Total return of the Russell 2500 Index was measured against the US Small/Mid-Cap Equity Universe in eVestment.
3 Data Source: Ned Davis Research and Morningstar, 2/24.
4 Data Source: “Mutual Fund Managers Are Wrong More Than They’re Right.” Morningstar.
Additional Sources
- J.P. Morgan. “Are Overlooked Small- and Mid-Cap Stocks About to Surge?” J.P. Morgan.
- “80% of Equity Market Cap Held by Institutions.” Pensions & Investments, 25 Apr. 2017.
- “The Cyclical Nature of Active and Passive Investing.” Hartford Funds.
- “The Case for Active Management in International Equities.” Dividend.com.
- “The Regime Shift Underway May Bring Favorable Tailwinds for Active International Equity Investors.” Schroders.
- “Trillions: A New History of the Rise and Rise of Passive Investment.”
- “Degrees of Difficulty: Indications of Active Success.” S&P Global.
- “Active vs. Passive Money Management.” Baird.
- “Market Concentration, Dispersion, and the Active-Passive Debate.” State Street Global Advisors (SSGA).
- “Michael Green’s Warning: Why Passive Investing Could Crash the Market.” Wealthion.
IMPORTANT DISCLOSURES
The views and opinions included in these materials belong to their author and do not necessarily reflect the views and opinions of NewEdge Capital Group, LLC.
This information is general in nature and has been prepared solely for informational and educational purposes and does not constitute an offer or a recommendation to buy or sell any particular security or to adopt any specific investment strategy.
NewEdge and its affiliates do not render advice on legal, tax and/or tax accounting matters. You should consult your personal tax and/or legal advisor to learn about any potential tax or other implications that may result from acting on a particular recommendation.
The trademarks and service marks contained herein are the property of their respective owners. Unless otherwise specifically indicated, all information with respect to any third party not affiliated with NewEdge has been provided by, and is the sole responsibility of, such third party and has not been independently verified by NewEdge, its affiliates or any other independent third party. No representation is given with respect to its accuracy or completeness, and such information and opinions may change without notice.
Investing involves risk, including possible loss of principal. Past performance is no guarantee of future results.
Any forward-looking statements or forecasts are based on assumptions and actual results are expected to vary from any such statements or forecasts. No assurance can be given that investment objectives or target returns will be achieved. Future returns may be higher or lower than the estimates presented herein.
An investment cannot be made directly in an index. Indices are unmanaged and have no fees or expenses. You can obtain information about many indices online at a variety of sources including: https://www.sec.gov/answers/indices.htm.
All data is subject to change without notice.
© 2024 NewEdge Capital Group, LLC


