
Weekly Summary: October 25 – 29, 2021
Key Observations:
- Overall equity volatility remains very low while bond volatility accelerates.
- The flattening yield curve might indicate increasing pessimism on future economic growth. The bond market appears to focus on the “slowing” part of the equation without recognizing a still expansionary economy.
- Risk/reward of purchasing Value/Cyclical type stocks looks attractive given the “valuation gap” among sectors at current prices and assuming expansionary economic growth.
- We still expect interest rates to rise and the yield curve to reverse at least partly this month’s flattening
The Upshot: The rather abrupt changes in interest rates and the shape of the yield curve show that quick sentiment changes often lead to quick changes in financial markets. The great dispersion of investors’ views on economic growth rates, supply chain disruptions and inflation make the financial markets more susceptible to sudden shifts in sentiment. We were comforted in our views that the best performing S&P 500 sectors for October were the more Value/Cyclically-oriented sectors in spite of the yield curve flattening this month. We still maintain holdings in big cap growth stocks for long-term appreciation.
Comparing Equity and Bond Volatility
Unlike Leon Bridges, we never said that navigating the financial markets would be “Smooth Sailin’.” Most of the major U.S. equity averages appeared to be a rather smooth ride during 2021. However, the underlying individual stocks and sector rotation has been rather tumultuous this year. U.S. interest rates have exhibited much more volatility this year compared to equities. According to a Goldman Sachs October 25 report, realized measures of volatility for the S&P 500 equity index were recently below the tenth percentile for the first time since 1970. The Chicago Board Option Exchange’s Volatility Index (VIX) has been hovering around the 15 level, before finally rising above 17 mid-week. The VIX is merely a measure by which the CBOE gauges the stock market’s expectation of volatility based on options on the S&P 500 index. In our view, the gap between the VIX level and macro-uncertainties seems very large. We maintain that these uncertainties have instead been reflected in the underlying stocks and sectors. These uncertainties also have been reflected in increased measures of implied and realized volatility for interest rates, especially with regard to shorter-duration rates such as the 2-year Treasury yield. In its report, Goldman Sachs indicated that the current gap between measures of volatility between equities and bonds is at a four-year high.
Valuation “Gaps” Among Sectors
Historically large “gaps” are also apparent between valuations of various sectors in equity markets. We have focused on such gaps in our determination to evaluate the best risk/reward purchasing opportunities in equities. According to J.P. Morgan’s (JPM) October 25 report, the top three sectors globally that have the highest positive correlation with bond yields trade at a 9.3x P/E. Alternatively, the top 3 sectors that have the largest negative correlation with bond yields trade at a 20.1x P/E, which represents a 54% gap. Similarly, MSCI Value vs. Growth global index reveals that the current 72% Price/Book (P/B) discount is significantly higher than the 51% discount historical trend.
Source: J.P. Morgan, Equity Strategy: How significant is the valuation dispersion of different parts of the market? (10/25/2021)
Flatter Yield Curve
Given our assumption of a slowing but continuing relatively robust global economic growth into 2022 and our expectation of rising interest rates, we believe that the great valuation gaps indicated above made the risk/reward in purchasing Value/Cyclical type stocks over more Defensive/Growth type stocks especially appealing. Through Thursday, the S&P 500 advanced 6.5% for October, which is on track for its “best” October since 2015. In general, Value/Cyclically oriented sectors delivered the best performance during the month so far. This superior performance was in spite of the U.S. Treasury yield curve flattening in October. In fact, a very dramatic single-day yield curve flattening occurred mid-week. On October 28, JPM agreed with many market participants that the dramatic one-day flattening was a largely “technical” move that will revert. We generally agree. Once again, it appeared that rather one-sided positioning – betting on a “steepening” yield curve – might have been a contributing factor. Yield curves flatten when longer duration yields trade lower relative to the movement of shorter duration yields.
Surprisingly Hawkish Bank of Canada (BOC)
The catalyst for this one-day move appeared to be a reaction to Canada central bank’s (BOC) very hawkish pronouncements at its regularly scheduled meeting. Much to the surprise of financial markets, BOC announced the end of its asset purchasing program – quantitative easing – and its decision to begin raising certain rates sooner than expected. Most analysts now assume that rate increases will start as early as April, 2022. According to a Bloomberg October 28 report, BOC also increased its 2022 inflation forecast from 2.4% to 3.4%. On the same day, Goldman Sachs became yet another firm recently to raise its inflation forecasts for well into next year.
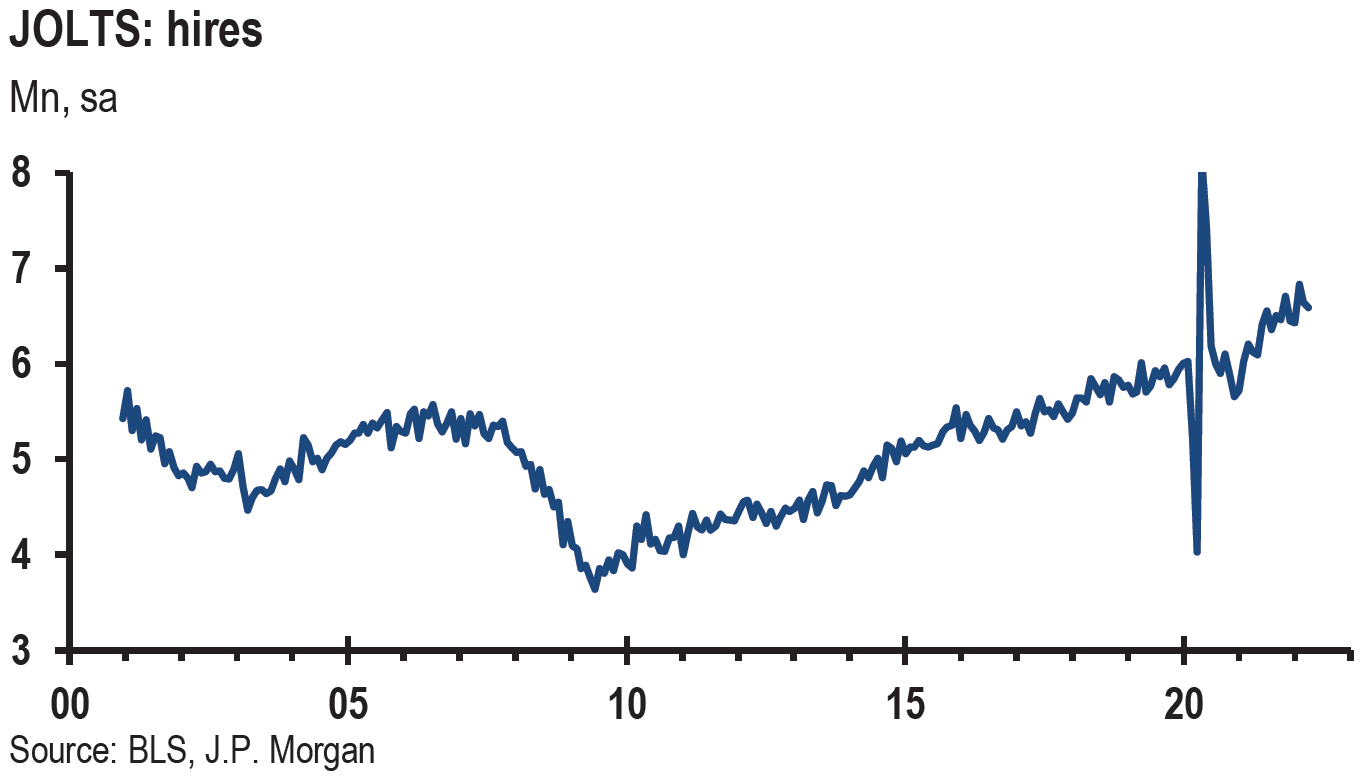
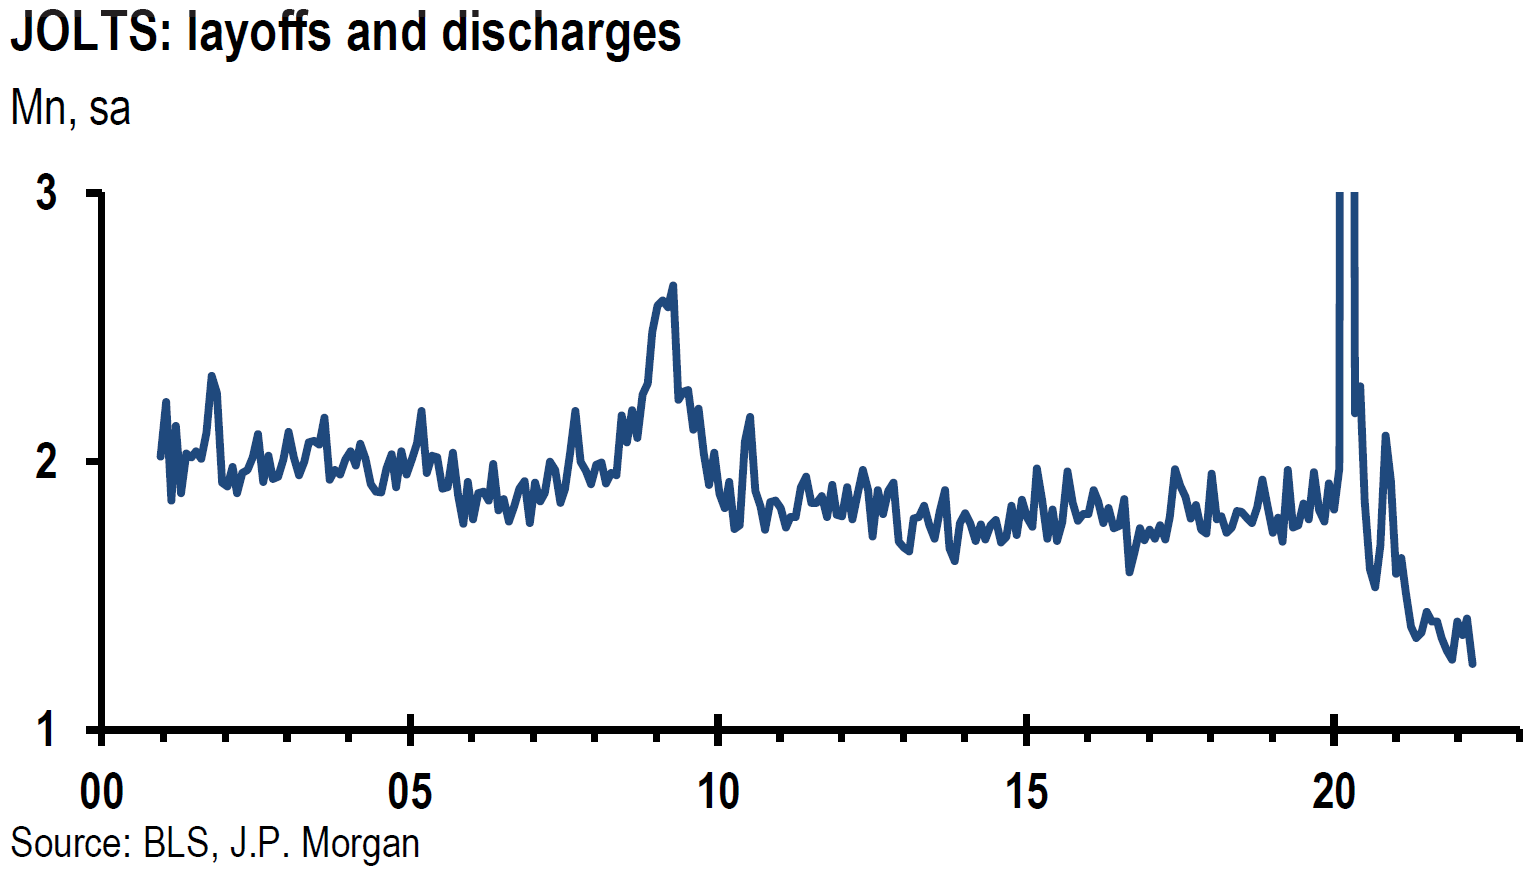
Slowing Economic Growth Expected to Rebound
A flattening yield curve is generally interpreted as an indication of slowing economic growth. Thursday’s unexpectedly weak U.S. Q3 GDP report would seem to confirm this notion. But we agree with Citi Research’s October 28 assessment that the underlying components of this GDP report revealed an economy that should be expected to rebound. Consumer consumption was better than expected, especially in regard to services consumption. The weakness in durable goods consumption and business inventory growth was “clearly” tied to supply constraint issues and not to the lack of demand. A shortfall in net exports also reflected the disappointing growth. In addition to supply issues, lingering effects from Hurricane Ida also negatively impacted exports. Semiconductor shortfalls continued to account for drastic cutbacks in auto production and sales. We anticipate more robust economic growth in the U.S. and globally as supply issues are resolved and as coronavirus infections dissipate.
Source: Citi, US Economic: Strong capital goods shipments supportive for Q3 investment (10/27/2021)
Source: Citi, US Economic: Softest GDP growth of pandemic-recovery due to supply issues (10/28/2021)
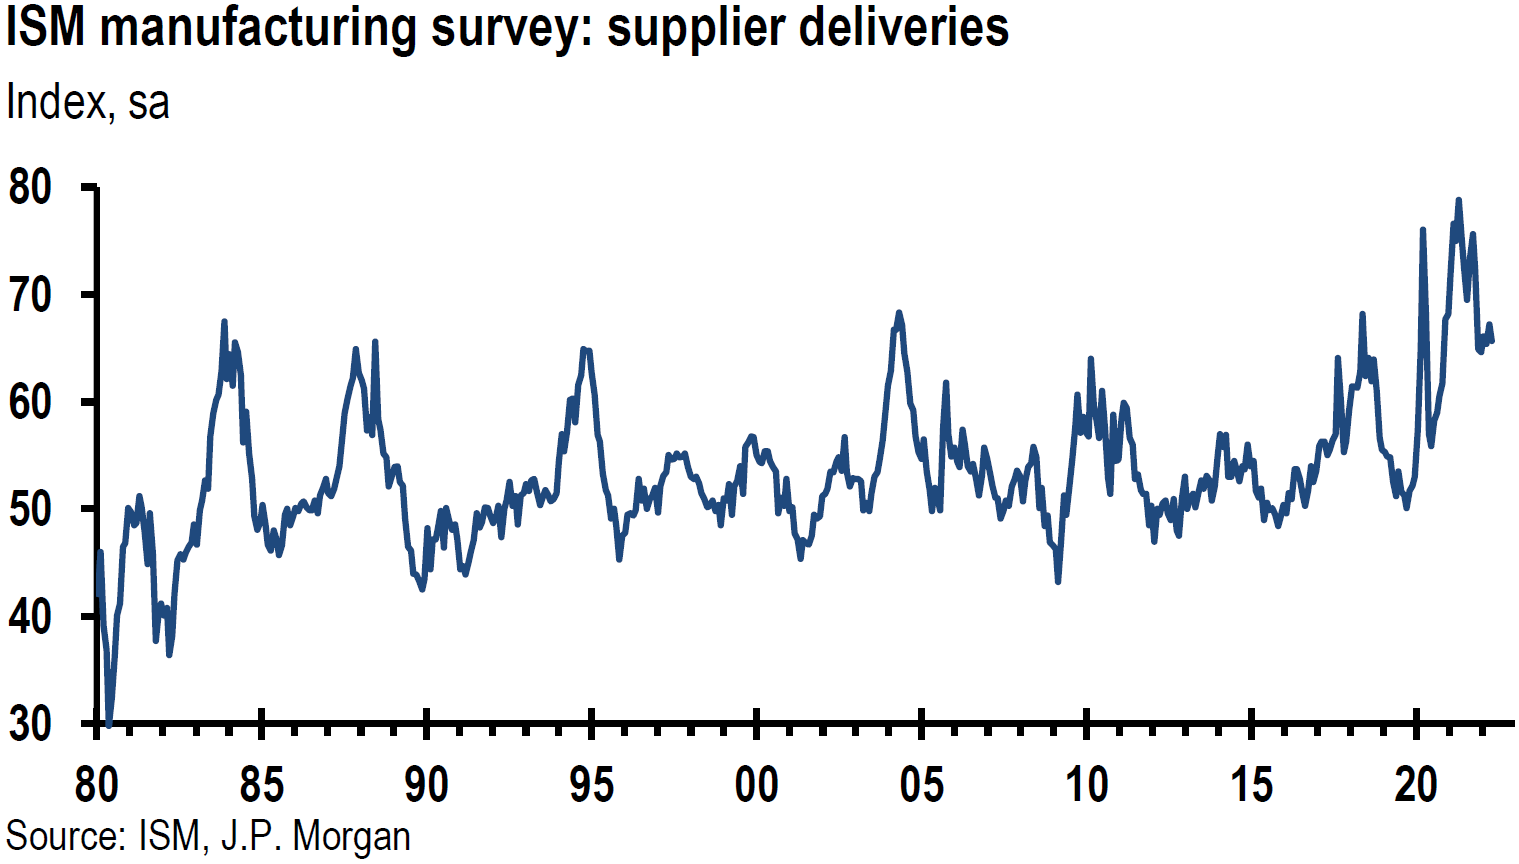
Surveys and PMIs – Still Expansionary and Elevated Prices
All the latest surveys of business activity and sentiment in manufacturing and services conducted by various regional Federal Reserve Banks showed sometimes sluggish, yet continued robust growth. In general, supply issues continued to constrain production and contributed to higher input costs, which were often passed on to the ultimate customers. Most business executives who participated in these surveys were optimistic about their business prospects over the next six months and typically forecast continued elevated prices. Lead times typically continued to lengthen, sometimes to record levels. It should be noted that at times when the index levels of business activities increased, sometimes the number of respondents who anticipated better and those who anticipated worse both increased. Like many aspects related to the pandemic, there are many “uneven” effects. The IHS Markit Purchasing Managers’ Index (PMI), announced at the end of last week that, due to benefits from the recent decline of COVID-19 infections, the U.S. services sector for October was stronger than expected. The manufacturing PMIs continued to be subject to persistent supply chain constraints and long delivery times. Increased prices were very prevalent. Europe’s PMIs were not as robust as those of the U.S. It appeared that Germany’s economy was largely responsible for the relative softness. All U.S. and European PMIs remained in expansionary territory.
Inflation Uncertainty Rises
The University of Michigan’s Consumer Sentiment October survey was released on October 29. Consumer sentiment remained near pandemic lows, while inflation expectations for the next twelve months rose to a thirteen year high of 4.8%. Inflation expectations for the next five years was 2.9%, just off the pandemic high of September’s 3% reading. But accompanying raised inflation expectations, “consumers also expressed greater uncertainty about the year-ahead inflation rate than anytime in nearly forty years.” This “was the first major spike in inflation uncertainty recorded outside a recession. Even uncertainty about the long-term inflation rate was the highest in more than a decade.” One of the main conclusions of this report was that “the pattern of consumers’ reactions to recent rises in inflation represent the preconditions that can promote an escalating inflation rate during the year ahead.” We believe elevated inflation expectations in conjunction with greater uncertainty, will most likely, lead to consumers acting as if rising inflation will be persistent. This attitude will only accentuate the propensity of inflation to not only be more persistent, but also higher than it would be otherwise.
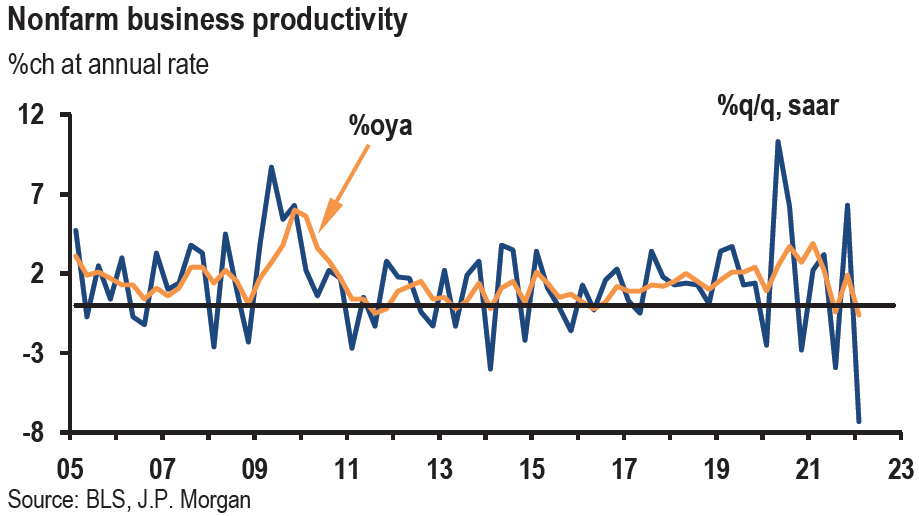
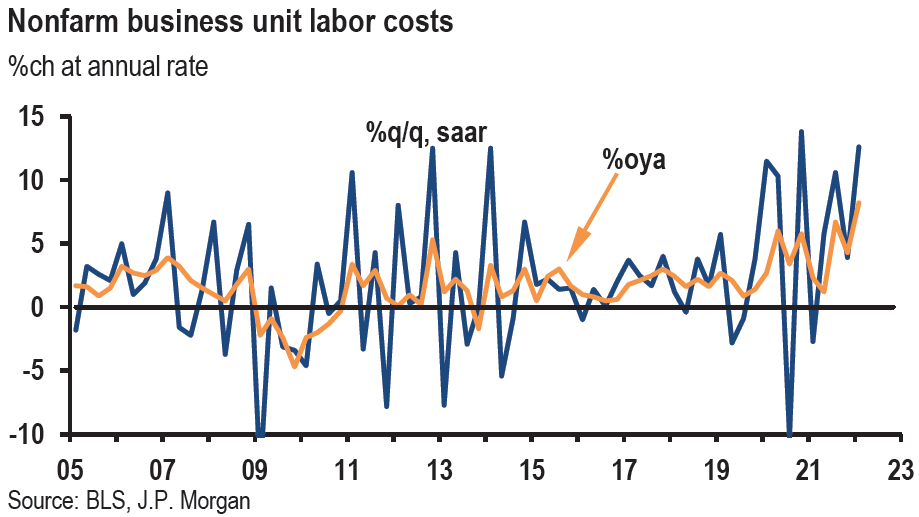
Wage Pressures Continue to Escalate
The U.S. Bureau of Labor Statistics (BLS) also announced its Employment Cost Index (ECI) for September on October 29. Total compensation grew significantly more than expected. According to a Bloomberg report that day, this is the Fed’s preferred gauge of wage inflation. This gauge is usually less volatile and generally lower than other measures of wage growth. This report confirmed that “the pace of wage growth has picked up briskly … and the total compensation increase suggests that labor-cost growth is the fastest in more than two decades.” The ECI is especially noteworthy because its “methodology keeps the industry composition constant across sample periods, preventing wage growth from being exaggerated when lower paying jobs … drop out of the measurement.” As we have previously described, wage increases are a critical component of more persistent types of inflation.
U.S. Business Executives Generally Optimistic
It appears that many European business executives are not as sanguine about their future business prospects over the next six months as their American counterparts are. The German-based ifo Institute’s business climate index announced early this week exhibited less optimism compared to the previous month. Pessimism was notable with respect to trade. This should not be surprising since the German economy is very sensitive to changes in China’s economy. Also announced early this week, the U.S. Conference Board’s consumer confidence index for October was better than expected, as concerns over the Delta variant eased. Although short term concerns over inflation reached a 13-year high, these concerns only had a “muted” effect on the respondents’ intentions to purchase durable goods or to take vacations.
Q3 – “The Beat Goes On” – Optimistic
Most U.S. companies continued to beat both earnings and revenue estimates during this peak week of Q3 reporting. Also, most companies appear to be optimistic about their future business prospects. We maintain our vigilance on profit margins and their sustainability. Given all the recently reported PMIs, surveys enumerated above and Q3 corporate results, we remain optimistic about a global GDP growth rebound in Q4 and continued solid growth in 2022. We still expect interest rates to rise overall in the near-to-intermediate term. We anticipate at least a partial reversal in the flattening of the yield curve. We will reevaluate our market expectations to the extent that our thinking on rates is not corroborated.
Upcoming Fed Meeting – Inflation Now More Persistent
Meanwhile, the Fed meets next week to decide on the timing and tapering of its asset purchase program. It looks like the great majority and investors have joined our assumption that the Fed will announce its decision to taper and that the actual tapering will begin in mid-November. It also appears that Fed Chair Powell has virtually embraced our notion that inflation has in fact become more persistent and can no longer be labeled as transitory. We expect the FOMC statement emanating from next week’s meeting to reflect more closely this characterization of inflation. According to the Wall Street Journal’s Weekend Edition of October 23-24, Powell made his inflation views rather clear in a teleconference last Friday. In Powell’s words, “supply-side constraints have gotten worse… The risks are clearly now to longer and more persistent bottlenecks, and thus to higher inflation.” He also stated, “I do think it is time to taper.” The Fed does not like to surprise financial markets. At this point, anything other than a tapering that would begin in mid-November would be a surprise.
Bottom Line
The overall equity averages continue to exhibit very low volatility levels in the face of many uncertainties. The apparent “Smooth Sailin’” of the equity averages continues to obscure the underlying turmoil and rotation of individual stocks and sectors. The amplitude and frequency of interest rate volatility measures have increased lately. We certainly would not characterize the bond market as “smooth.” We remain steadfast in our belief that the global economy will rebound in Q4 and then go onto further solid economic growth in 2022. Additionally, we continue to expect that inflation will be higher and more persistent than most investors and analysts anticipated. It seems, however, that our views on inflation have gained more widespread acceptance lately. We expect the Fed to announce “tapering” next week and actually to begin the tapering process in mid-November.
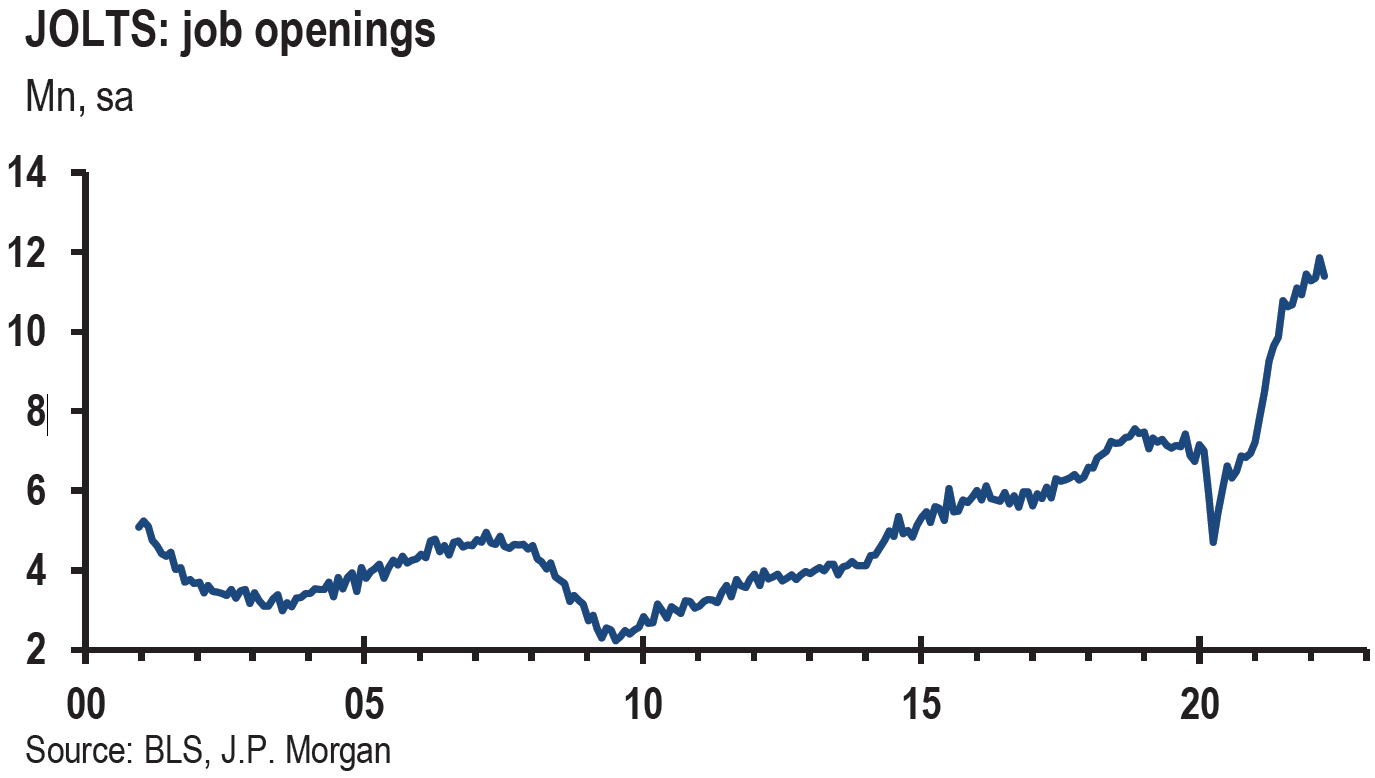
The timing of the resolution of supply constraints and disruptions will depend on many factors, including winter temperatures and other weather anomalies. It appears that finding qualified workers at reasonable levels of compensation might be a more intractable problem. Increasing wages are generally considered to lead to more persistent inflationary pressures. We also expect that shelter costs will continue to increase and contribute to more persistent inflationary trends.
The consumer sentiment survey results for October and the employment cost data of September, both released on Friday, only add to our conviction that inflation will be higher and more persistent than many believe. Furthermore, we maintain our expectation that interest rates will continue their ascent in an erratic fashion, and that the yield curve will eventually steepen in the short-to-intermediate term. We continue to expect more volatility in financial markets.
Although we don’t anticipate “Smooth Sailin,” we believe that financial markets will be navigable with the right crew.
Charts of Interest:
Source: J.P. Morgan, US Weekly Prospects (10/22/2021)
Source: Goldman Sachs: US Equity Views: Updating our 2022 S&P 500 cash use forecasts (10/28/2021)
Miscellaneous Definitions:
Ifo Institute for Economic Research is a German based company. Ifo Business Climate Index is a leading indicator of economic activity released monthly since 1972. The database underlying the index is a monthly survey of 7,000 in the construction, manufacturing, wholesale and retail industries.
MSCI is an American finance company serving as a global provider of various market indexes, among other things.
MSCI World Value Index captures large and mid-cap securities exhibiting overall value style characteristics across 23 Developed Markets countries. The value investment style characteristics for index construction are defined using three variables: book value to price, 12-month forward earnings to price and dividend yield.
NSCI World Growth Index captures growth style characteristics. Five variables are used for the construction of growth style indexes: long-term forward EPS growth rate, short-term forward EPS growth rate, current internal growth rate and long-term historical EPS growth trend and long-term historical sales per share growth trend
Stoxx 600 is a stock index of European companies. This index has a fixed number of 600 companies representing large, mid and small capitalization companies among 17 European countries, covering approximately 90% of the free float of the capitalization of European stocks.
INDEX DEFINITIONS
KBW Nasdaq Bank Index (BKX): The KBW Bank Index is designed to track the performance of the leading banks and thrifts that are publicly-traded in the U.S. The Index includes 24 banking stocks representing the large U.S. national money centers, regional banks and thrift institutions.
MSCI EM Value Index: The MSCI Emerging Markets Value Index captures large and mid cap securities exhibiting overall value style characteristics across 27 Emerging Markets (EM) countries.
MSCI EM Index: The MSCI Emerging Markets Index captures large and mid cap representation across 27 Emerging Markets (EM) countries.
NASDAQ: The Nasdaq Composite Index is the market capitalization-weighted index of over 2,500 common equities listed on the Nasdaq stock exchange.
PCE: Personal Consumption Expenditures (PCEs) refers to a measure of imputed household expenditures defined for a period of time.
Russell 1000 Growth: The Russell 1000 Growth Index measures the performance of the large-cap growth segment of the U.S. equity universe. It includes those Russell 1000 companies with higher price-to-book ratios and higher forecasted and historical growth values.
Russell 1000 Value: The Russell 1000 Value Index measures the performance of the large-cap value segment of the U.S. equity universe. It includes those Russell 1000 companies with lower price-to-book ratios and lower expected and historical growth rates.
S&P 500: The S&P 500 Index, or the Standard & Poor’s 500 Index, is a market-capitalization-weighted index of the 500 largest publicly-traded companies in the U.S.
VIX: The VIX Index is a calculation designed to produce a measure of constant, 30-day expected volatility of the U.S. stock market, derived from real-time, mid-quote prices of S&P 500® Index (SPX℠) call and put options.
Z-Score: A Z-score (also called a standard score) gives an idea of how far from the mean a data point is. It is a measure of how many standard deviations below or above the population mean a raw score is.
IMPORTANT DISCLOSURES
The views and opinions included in these materials belong to their author and do not necessarily reflect the views and opinions of NewEdge Capital Group, LLC.
This information is general in nature and has been prepared solely for informational and educational purposes and does not constitute an offer or a recommendation to buy or sell any particular security or to adopt any specific investment strategy.
NewEdge and its affiliates do not render advice on legal, tax and/or tax accounting matters. You should consult your personal tax and/or legal advisor to learn about any potential tax or other implications that may result from acting on a particular recommendation.
The trademarks and service marks contained herein are the property of their respective owners. Unless otherwise specifically indicated, all information with respect to any third party not affiliated with NewEdge has been provided by, and is the sole responsibility of, such third party and has not been independently verified by NewEdge, its affiliates or any other independent third party. No representation is given with respect to its accuracy or completeness, and such information and opinions may change without notice.
Investing involves risk, including possible loss of principal. Past performance is no guarantee of future results.
Any forward-looking statements or forecasts are based on assumptions and actual results are expected to vary from any such statements or forecasts. No assurance can be given that investment objectives or target returns will be achieved. Future returns may be higher or lower than the estimates presented herein.
An investment cannot be made directly in an index. Indices are unmanaged and have no fees or expenses. You can obtain information about many indices online at a variety of sources including: https://www.sec.gov/fast-answers/answersindiceshtm.html or http://www.nasdaq.com/reference/index-descriptions.aspx.
All data is subject to change without notice.
© 2024 NewEdge Capital Group, LLC


