
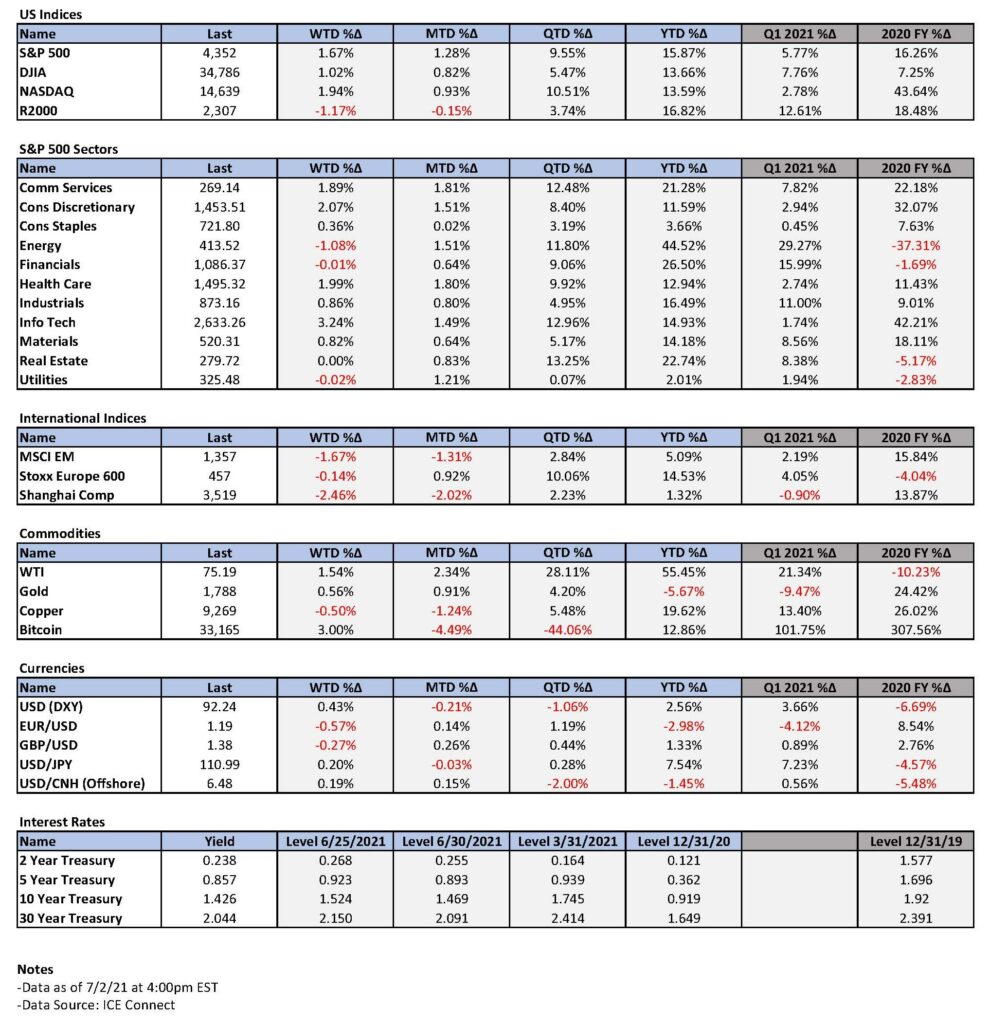
Weekly Summary: June 28 – July 2, 2021
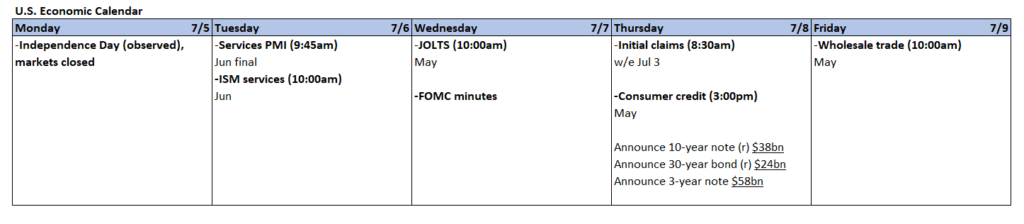
The latest data release could be the next determinant of financial markets’ directions. Data might confirm certain opinions while dispelling others. Any news concerning labor markets, wages, and inflation (both price increases and expectations) will be closely scrutinized. The Federal Reserve’s admission of data dependence has made its policies very sensitive to such releases. U.S. nonfarm payrolls, including accompanying statistics such as average hourly earnings, hours worked, etc., will remain the most important data set for the foreseeable future. Such numbers will shape the Fed’s policy decisions, and the chance of volatility on their release dates has increased. The release of ISM indexes (also known as purchasing managers indexes) will also continue to influence financial markets. We all await the next group of data points, along with Fed meetings and official pronouncements, as harbingers of volatility and repositioning.
Where positioning in various markets is one-sided, more volatility should be expected. Judging by measures of low volatility, especially in U.S. equities, investors seem either very complacent or very uncertain. In a June 28 report, Citi Research opted for the latter. Citi believed that before this week’s U.S. payroll announcement, investors’ conviction remained low and showed “little appetite for directional exposure.” In fact, on June 29, Citi cited S&P 500 futures activity as increasingly on the long side. Net shorts in such futures activity recently approached 32-year lows. In fact, Citi believed that at least some of last week’s S&P gains resulted from short covering. In contrast, investors in European stock futures seemed reluctant to commit in either direction.
Key observations:
- Volatility levels of many asset classes—especially overall U.S. equities—are very low.
- Domestic positioning remains decidedly one-sided—long on the S&P 500.
- Positioning in European equities is not as one-sided and such equities are now favored by many investors and analysts.
- Input and output prices continue to rise even as economic growth slows. Supply and labor shortages continue to be a drag on production and economic growth, but underlying demand remains strong.
- Wage growth continues to rise and may be broadening.
The upshot: To the extent consensus expectations are surprised by the latest significant data and positioning is on the “wrong” side, market volatility could surprise as well. We wait, we watch, we react—or maybe we don’t.
The road to payroll data
Ahead of Friday’s U.S. payrolls announcement, the S&P 500 traded in a very narrow range through Thursday. The Dow, Russell 2000, and Nasdaq also traded in rather narrow ranges during those four days, with the latter showing the least downside. Once again, underlying sector rotation was more volatile than the overall equity averages. Evidently, most investors are bullish (or at least see little downside in equities). However, they seem less sure of what to own. In general, the more defensive sectors outperformed early this week. Tech led all sectors through Thursday, with defensive stocks generally best the first two days, value and cyclicals outperforming on Wednesday, and a mixed showing on Thursday. Even though energy led the pack late in the week, it performed worst over those four days overall.
The 10-year Treasury yield dropped 5 bps on Monday, to 1.49%, and held steady over the next three days. (By contrast, last week value and cyclical stocks led a broad-based rally as the 10-year yield rose 8 bps to 1.524%. The only S&P 500 sector to gain that week—just barely—was tech. The Value and cyclical stocks dramatically underperformed that week as the 10-year Treasury yield dipped 1 bps to 1.443%.
European Cyclical Equities vs. Defensive Equities Relative Price
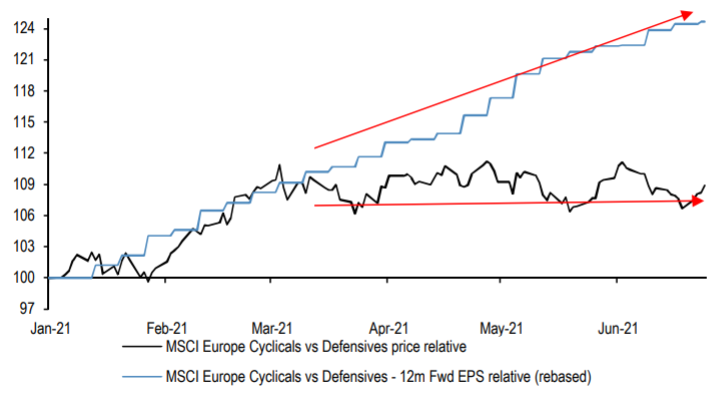
Source: J.P. Morgan Equity Strategy Report, June 28
Payroll data – muted response
U.S. nonfarm payroll data surprised on the upside – +850,000 added jobs in June vs. a consensus estimate in the 720,000 range. Supposedly there was a “whisper number” of 800,000. The unemployment rate rose to 5.9% from 5.8% vs. expected 5.6%. The labor force participation rate was unchanged at 61.6%, almost 2% less than the pre-pandemic rate. Average hourly earnings rose 0.3% m/m, basically in line. But leisure and hospitality wages increased by 1.0% m/m for a sixth straight month of wage gains over 0.5%m/m. This sector accounted for 343,000 of June’s job increases. The morning reaction to this news was that the 10 year yield dropped 2 bps to 1.44% and USD traded slightly lower. The S&P 500, Dow and Nasdaq were all slightly higher, but the Russell 2000 lost about 1%. Once again, tech was the best performing S&P 500 sector in the context of more defensive sectors outperforming. Financials and energy were the 2 worst early performers. Given this new data and the markets’ reaction… the wait continues.
Steady on
On June 28, Goldman Sachs observed that both implied and realized volatility were below historic averages for most assets. The following day, Goldman noted, implied and realized volatility for both investment-grade and high-yield indexes were approaching all-time lows. Meanwhile, the VIX index (30-day forward projection of S&P 500 volatility) was close to a one-year low.
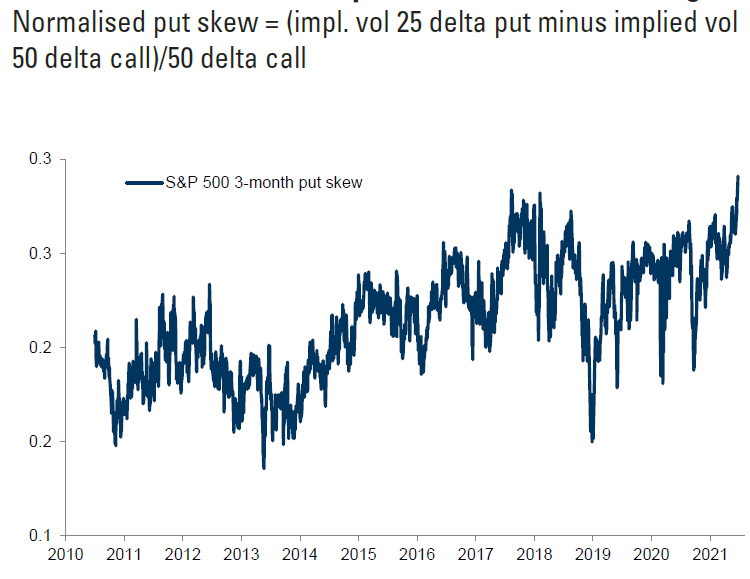
Interest-rate volatility was more elevated. Certain volatility measures of longer-dated U.S. Treasuries were at their highest levels vs. the S&P 500 since 2018. But the S&P’s three-month “put skew” (comparing puts to calls) hit a multi-decade high. In other words, those three-month puts were very expensive; in fact, the relative price of downside protection (compared to upside) has never been higher. Investors are likely worried that if U.S. equities start to trade lower, volatility could increase accordingly.
S&P 500 3-month put skew is at historical highs
Cross-Asset Volatility, Current and Historical Percentiles, Implied 3m and Realized 1m
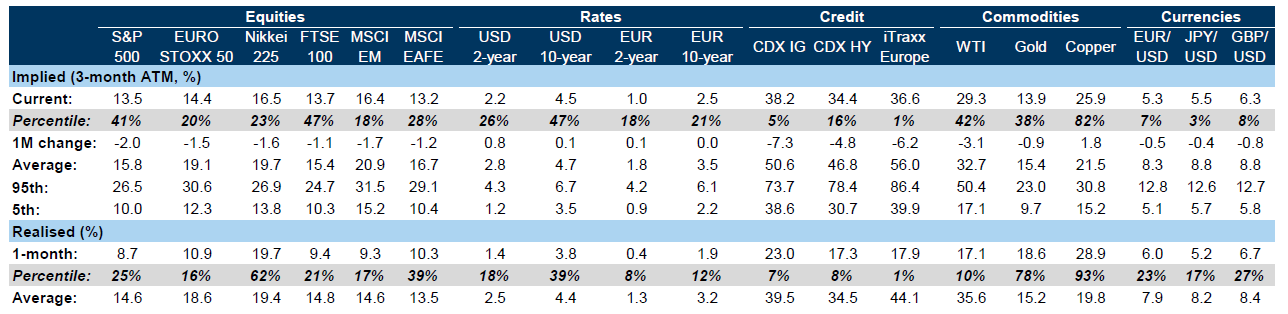
Source: Goldman Sachs, “Low Vol Regime Looms”, June 28
Equity bulls abound
As further evidence of underlying equity bullishness, yesterday JPMorgan observed that as U.S. stock averages have hit new highs, retail investors continue to be buyers. The most recent five-day moving average of equity inflows is at the 94th percentile over the past year—its highest level since early April. A large proportion of retail buying was through ETFs, especially in the discretionary and industrial sectors. JPMorgan also attributed a noticeable recent trend toward defensive stocks at least partly to the more infectious Delta variant of the COVID-19 virus. Nevertheless, JPM prefers reopening beneficiaries such as Value and cyclical equities over more defensive positions. This view is buttressed by the Delta variant’s relatively low fatality rate (though this could be due to high vaccination rates and that non-vaccinated people tend to be younger).
On June 25, Goldman Sachs said that as long as policymakers focus primarily on keeping hospitalization rates low, the Delta variant will be a manageable risk to economic reopenings. As many as 90% of new coronavirus infections in the U.K. are attributable to the variant, whose incidence is rising—sometimes above 60% of new cases—in many other European countries as well. (In the U.S., about a third of new cases are attributable to the Delta variant, a portion that’s tripled over the past 10 days.) Low vaccination rates (and greater susceptibility to the Delta variant) in many emerging markets will likely increase the possibility of further lockdowns, which could delay their economic recoveries. More supply chain disruptions might produce more shortages and further exacerbate inflationary pressures.
Nevertheless, most of us still assume that high vaccination rates in many areas mean we don’t have to worry about further shutdowns due to increased coronavirus infections. But the Delta variant could be more disruptive than many believe. Where vaccination rates are low, the Delta variant could become problematic. Other variants and mutations are also possible. Even so, any widespread lockdowns are highly unlikely at this point. Most investors will simply ignore the negative possibilities from more lethal and contagious mutations.
Stocks not reacting to rates
Before the hawkish Fed meeting last week, interest rate movements seemed to be the principal driving force behind equity movements in general (and sector rotations in particular) this year. Since then, equities seem to be more on their own. Despite last week’s broadly positive performance, led by value and cyclical stocks, sector rotation has become even more variable day to day.
Given the current preeminence of, well, whatever the latest data reports happen to be, which trends should we focus on in this context? Since many investors seem to lack conviction on some investments, positioning effects will continue to be important. The most critical debate remains over whether inflation is transitory or will become more persistent. What do the latest data show us? As we have noted previously, shelter costs—a key component of persistent inflation—are expected to continue to rise. But the greater focus is on inflation expectations and wage increases, both considered critical for inflation to be more persistent.
Pricing power and inflation expectations
Expectations of robust economic growth could make it easier for companies to exert their pricing power. The Conference Board’s June consumer confidence index, announced this week, beat expectations by a wide margin. Boasting improvements in both current conditions and expectations, consumer confidence rose for the fifth straight month, to its highest level since the pandemic began. Almost 55% of consumers said that jobs were “plentiful.” The labor differential (the difference between the percentage of respondents calling jobs plentiful and those saying jobs are hard to get) rose by almost 18%, to its highest level since 2000.
Meanwhile, the University of Michigan’s consumer sentiment index, announced last Friday, improved in June—but inflation concerns continued to cloud respondents’ outlooks. The index remains about 15% below its February 2020 level. The survey’s chief economist said that most of the June increase came from households with incomes above $100,000, who were optimistic about economic prospects: The survey showed improved expectations for inflation over both one year (4.0%, down from 4.6% in May) and five years (2.8%, vs. 3.0% in the prior month). By comparison, PCE core inflation—the Fed’s preferred inflation gauge—rose by 3.4% in May vs. the previous year (its highest rate since 1992), up from 3.1% year-over-year in April.
Been here before
Many economic statistics continued to show strength this week. Housing prices rose at or near record rates. The wages and benefits indexes were at record highs, the selling price index broke its record, and input costs were the highest since 2008.Likewise, manufacturing PMI data released by the Institute for Supply Management and IHS Markit continued to show record or near-record rises in input costs, difficulty in attracting and maintaining the needed labor force and continued supply chain issues. And even though the Dallas Fed services survey showed slightly less optimism than in May, perceptions of broader business conditions remained positive. In other words, the same old story.
Developed Market Composite PMI
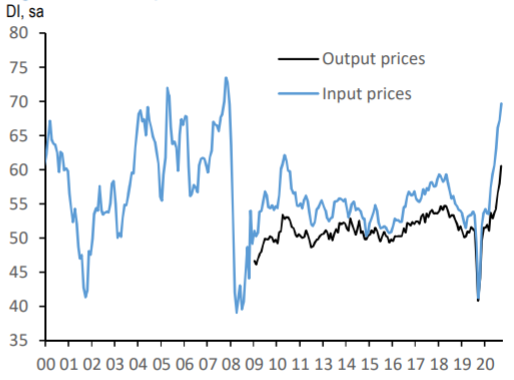
Source, J.P. Morgan View Report, June 30
The Inflation Rates of Supply-Constrained Goods are Substantially Above Trend
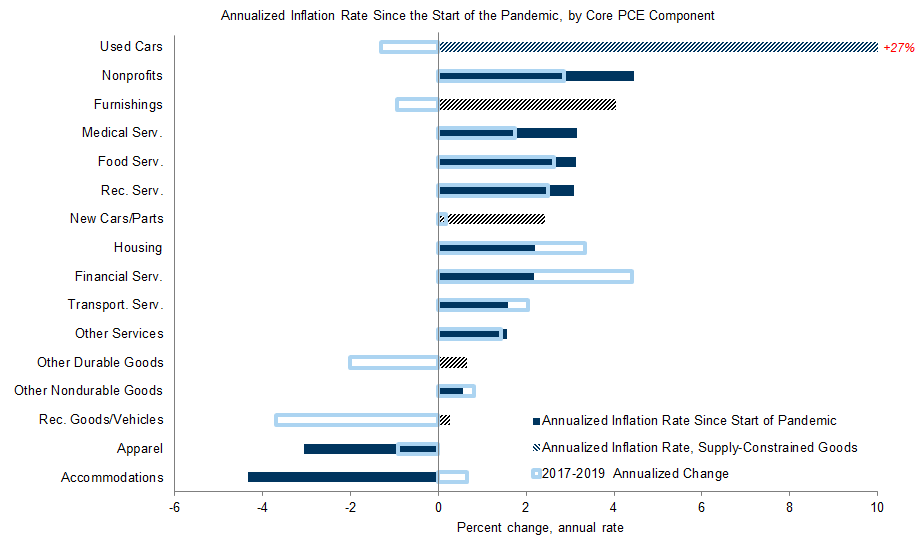
Source: Goldman Sachs, “How Average Inflation Reaches 2%”, June 29
Supply-Constrained Goods Have Contributed 80bp More Than
Usual-to-Average Annualized Core PCE Inflation Since the Pandemic
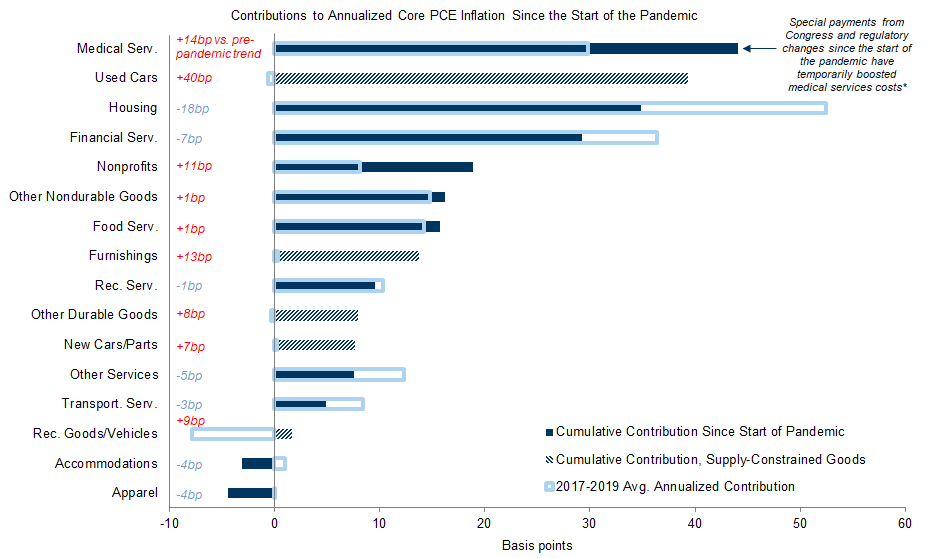
Source: Goldman Sachs, “How Average Inflation Reaches 2%”, June 29
We Estimate That the Contribution to Year-on-Year Inflation From Supply-Constrained Categories
Will Swing From +105bp Now to +35bp at End 2021 and -55bp at End 2022
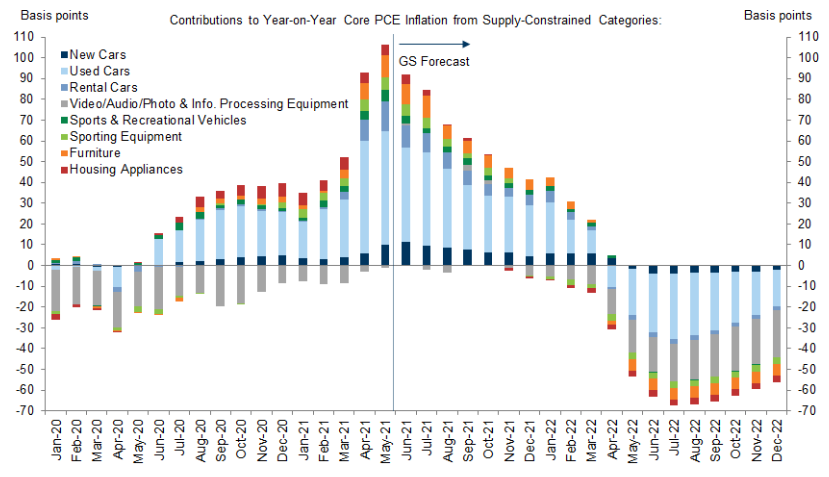
Source: Goldman Sachs, “Supply Chain Disruptions and the Inflation Outlook”, June 27
Investor perspective—and positioning
Understanding investors’ views can help us better anticipate positioning effects. Given recent economic statistics, it’s not surprising that in a Citi survey of nearly 70 pension funds released June 25, over half believe that “sticky” inflation is the most likely scenario, while only 33% think inflation is probably transitory. European stocks were most favored, followed by commodities and U.S. equities. These funds also favor energy over financials, think oil and metals prices have a substantive effect on inflation expectations, and their positioning seems to have been affected by “tape watching.”
Maybe most surprising to Citi is that the funds see capital expenditures as the biggest use of corporate cash, ahead of stock buybacks and M&A. But perhaps most importantly, the Fed has become the “over-arching” issue. Indeed, the greatest risks they cited: Fed policy and inflation.
Stargazing across the pond
Although U.S. 2Q GDP growth is still expected to be very strong, some economists have recently lowered their forecasts. JPMorgan’s estimate, reported June 25, fell to an annualized 9% on weak inventories and continued supply chain disruptions. Likewise, on the same day Goldman Sachs called for 2Q GDP growth of 8.5%, down from its recent forecast of 10%.
Why the weaker domestic forecasts? Since the latest CPI data, Goldman has been disappointed by lower-than-expected U.S. business activity. In fact, they now acknowledge that their projected GDP growth rate for the third quarter, 9.5%, could be the highest of the year. Much like the Citi survey, on June 28 BlackRock noted the June surge in European business activity and said it now thinks developed market stocks outside the U.S. will better capture the reopening trade. Moreover, on June 28 Goldman noted that year-to-date mutual fund flows into European stocks were the strongest since 2015. JPMorgan’s June 28 forecast for global GDP growth (6.7% for the second half of the year) underscored its preference for non-U.S. stocks. They also thought it significant that U.S. stocks have outperformed the rest of the world’s equity markets by an average of about 7% a year since 2008. Again, positioning seems to be critical to trading outcomes.
Pay more forward?
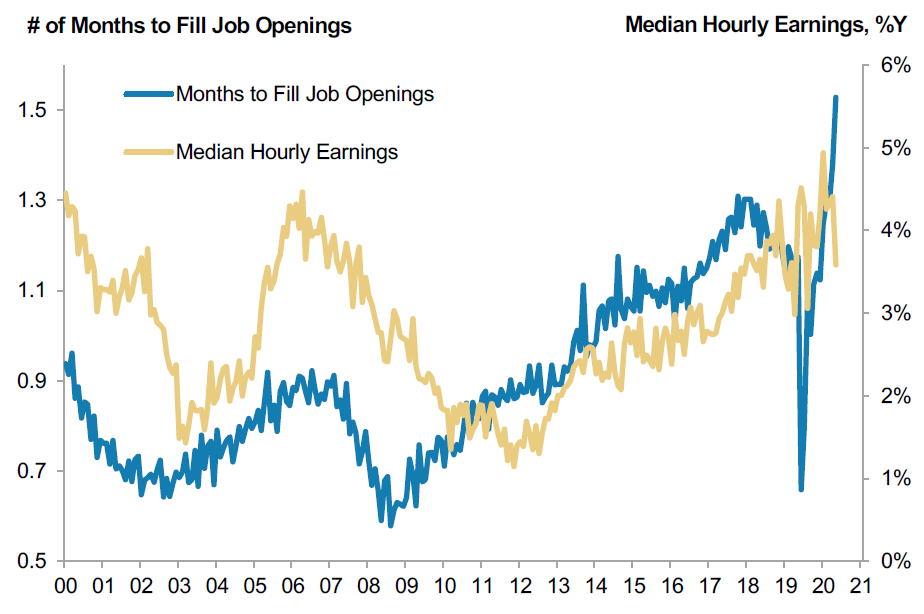
Let’s not forget the crucial element of wage inflation. Where is it? Who is most affected? Will it linger? As Morgan Stanley reported on June 28, various leading indicators point to labor market tightness in an increasing number of industries. Many companies intend to raise prices to offset wage increases. Not surprisingly, service-oriented industries seem to be at highest risk for wage inflation.
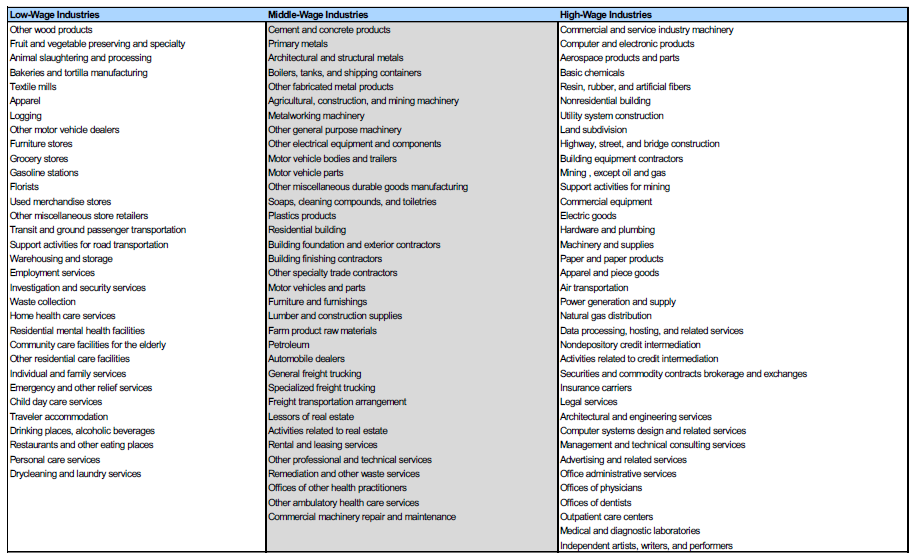
Morgan Stanley believes that to date, wage growth has been driven primarily by middle- and high-wage industries, the latter of which has seen the largest aggregate wage increases. (This contrasts with the later stages of the last expansion, when pay increases were led predominantly by lower-wage industries.) Recently the number of months to fill jobs has surged, a phenomenon that correlates with higher wages. Even though wage growth has been accelerating most in higher-wage industries, it’s still above trend in the “laggard” industries.
Like almost everything else about the pandemic, wage increases have been distributed unevenly. Morgan also sees potential long-term political momentum to support rising wages. Although wage growth in most industries is rising at a slower pace than inflation, total private sector wages are 2.6% above the pre-pandemic peak—even as payrolls are 5% below peak. Morgan believes that short-term labor supply issues during reopenings don’t fully explain wage increases, and that more fundamental and persistent drivers may be behind them.
Difficulties Hiring Workers Lead to Higher Wages
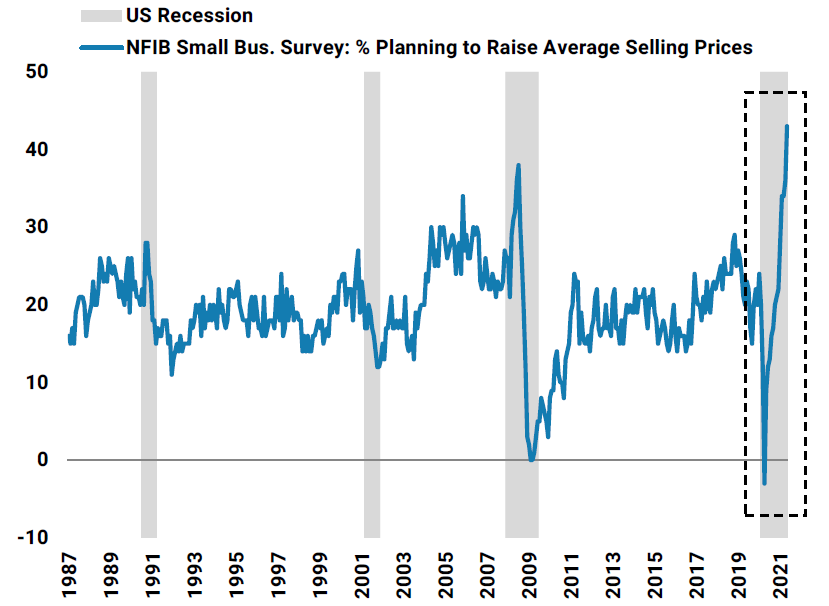
Businesses are Planning to Raise Selling Prices at a Record Pace
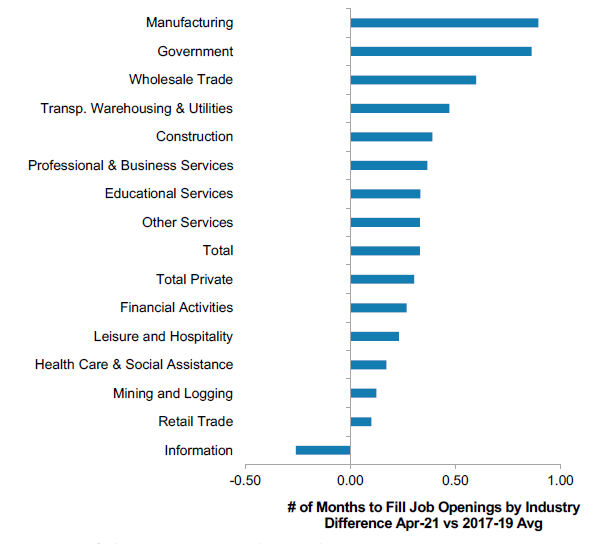
More Industries Facing Hiring Difficulties
Industries With Elevated Wage Pressures
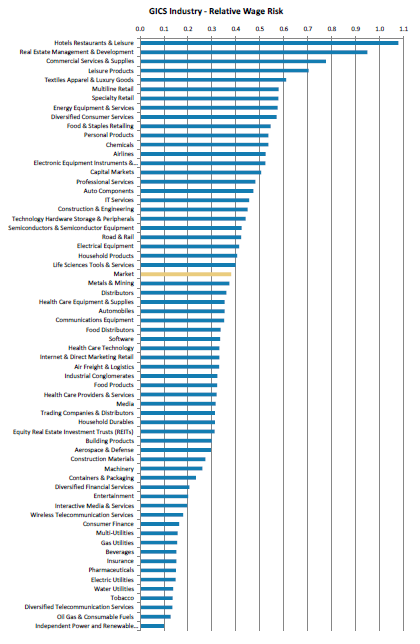
Services and Retail Oriented Industries Top Our Relative Wage Risk Index
Source: Morgan Stanley, “Wage Pressures: Quantifying the Risk”, June 28
Not so fast…
For its part, Goldman Sachs has a distinctly different view of wage growth. In a June 30 report, Goldman noted that although overall wage growth has been moderate, wages in lower-paid sectors have risen quickly—about 6% on average since the pandemic began. Indeed, leisure and hospitality saw pay increases as high as 8.25% in production and non-supervisory roles. (The inflation connection: Academic studies have found that industries where wages are typically 30%–50% of expenses usually pass on virtually all increased wage costs to customers.) With many unemployment insurance benefits expiring, among other factors, Goldman remains skeptical that wage increases will persist.
Another indication of Goldman Sachs’ skepticism of persistent inflation: An internal survey, reported on June 30, found that about 50% of companies covered by Goldman analysts were experiencing supply constraints, labor shortages, and supply chain disruptions. But “only” 50% of such companies experienced production shortfalls. About 75% of those analysts believed that delivery times would be normalized within nine months.
What do we do with all this information? We wait, of course, to see which assumptions and/or expectations are confirmed or denied. If significant data are far off consensus expectations, volatility should follow—even more so if positioning is on the “wrong” side.
Bottom line
The S&P 500’s overall stability has translated into low volatility measures. But the index continues to mask underlying sector volatility. Although investors might prefer some sectors over others, they generally share a bullish view and are positioned accordingly. Various measures and recent market reactions, however, indicate that generally bullish views may be shallow. S&P put skews suggest investor fears of increased volatility once the equity markets breach certain levels to the downside.
Increased volatility is likely when releases of key economic and inflation data differ from consensus views and positioning is generally “wrong-sided.” More negative news about the Delta variant or other more infectious and lethal variants could also lead to increased volatility.
Index Definitions:
VIX: The VIX Index is a calculation designed to produce a measure of constant, 30-day expected volatility of the U.S. stock market, derived from real-time, mid-quote prices of S&P 500® Index (SPX℠) call and put options.
Russell 1000 Value: The Russell 1000 Value Index measures the performance of the large-cap value segment of the U.S. equity universe. It includes those Russell 1000 companies with lower price-to-book ratios and lower expected and historical growth rates.
Russell 1000 Growth: The Russell 1000 Growth Index measures the performance of the large-cap growth segment of the U.S. equity universe. It includes those Russell 1000 companies with higher price-to-book ratios and higher forecasted and historical growth values.
NASDAQ: The Nasdaq Composite Index is the market capitalization-weighted index of over 2,500 common equities listed on the Nasdaq stock exchange.
S&P 500: The S&P 500 Index, or the Standard & Poor’s 500 Index, is a market-capitalization-weighted index of the 500 largest publicly-traded companies in the U.S.
MSCI EM Value Index: The MSCI Emerging Markets Value Index captures large and mid cap securities exhibiting overall value style characteristics across 27 Emerging Markets (EM) countries
MSCI EM Index: The MSCI Emerging Markets Index captures large and mid cap representation across 27 Emerging Markets (EM) countries
IMPORTANT DISCLOSURES
The views and opinions included in these materials belong to their author and do not necessarily reflect the views and opinions of NewEdge Capital Group, LLC.
This information is general in nature and has been prepared solely for informational and educational purposes and does not constitute an offer or a recommendation to buy or sell any particular security or to adopt any specific investment strategy.
NewEdge and its affiliates do not render advice on legal, tax and/or tax accounting matters. You should consult your personal tax and/or legal advisor to learn about any potential tax or other implications that may result from acting on a particular recommendation.
The trademarks and service marks contained herein are the property of their respective owners. Unless otherwise specifically indicated, all information with respect to any third party not affiliated with NewEdge has been provided by, and is the sole responsibility of, such third party and has not been independently verified by NewEdge, its affiliates or any other independent third party. No representation is given with respect to its accuracy or completeness, and such information and opinions may change without notice.
Investing involves risk, including possible loss of principal. Past performance is no guarantee of future results.
Any forward-looking statements or forecasts are based on assumptions and actual results are expected to vary from any such statements or forecasts. No assurance can be given that investment objectives or target returns will be achieved. Future returns may be higher or lower than the estimates presented herein.
An investment cannot be made directly in an index. Indices are unmanaged and have no fees or expenses. You can obtain information about many indices online at a variety of sources including: https://www.sec.gov/fast-answers/answersindiceshtm.html or http://www.nasdaq.com/reference/index-descriptions.aspx.
All data is subject to change without notice.
© 2021 NewEdge Capital Group, LLC


