I was dreaming when I wrote this
Forgive me if it goes astray
– Prince, “1999”
U.S. politics has been delivering more twists and turns lately than even the most melodramatic arc on The West Wing. And yet, diversified investors have come through the chaotic headlines mostly intact. Those gains have less to do with anything happening in the political realm and more to do with optimism about the economy stemming from the benign June U.S. CPI and PCE inflation readings. Falling inflation has led investors to price in a series of Fed rate cuts beginning in September.
Whether those rate cuts lead to an eventual “soft landing” for the economy remains an open question, but markets are behaving as if it’s a fait accompli. What is a soft landing? How likely are we to get one? And what portfolio strategies will work in such a scenario? We’ll explore those questions and more in this edition of the Weekly Edge as we try to figure out whether investors should be partying like it’s 1995.
“Could’ve sworn it was judgment day”: What even is a soft landing?
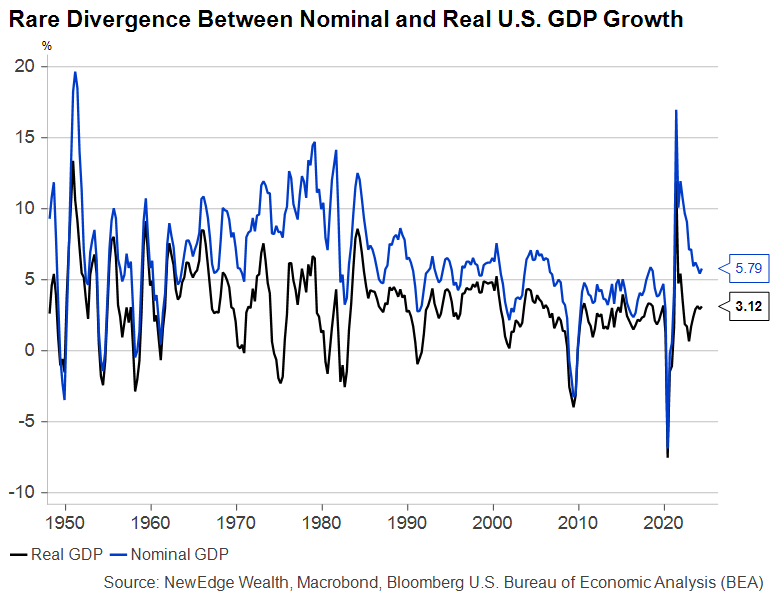
We are now almost exactly a year out from the Federal Reserve’s final interest rate increase of the cycle, and this week’s GDP release showed economic growth accelerating since then from a 2.4% to a 3.1% rate of annual growth. Meanwhile, core PCE inflation has fallen from 4.3% to 2.6%. The mix of slower nominal growth (which includes both output and price changes) and faster real growth (which measures output net of price changes) following a Fed tightening cycle is incredibly rare, fueling talk of a soft landing.
Our 2024 outlook called for a “strange landing”, and the mix of data we continue to see validates our view. A soft landing, on the other hand, would be an uneventful return to normal following a period of elevated interest rates and inflation without an intervening recession. Just because the Fed stops raising interest rates – or, indeed, begins to cut them – does not mean a soft landing is ensured. It takes a few quarters, at least, to confirm that the Fed has not eased policy too late.
The current consensus is that U.S. growth will slow but not turn negative as the Fed reduces its policy rate below 4% over the next eighteen months. That would qualify as a soft landing, the first since 1995. Given how long it’s been, it’s worth digging into what was happening in the mid-1990s and what relevance it has to today’s situation.
“If You Didn’t Come to Party…”: The 1995 Soft Landing
The key to the 1995 soft landing was the Fed’s ability to correctly forecast changes in inflation and adjust interest rate policy accordingly. But it was also responding to weaker payroll growth and cyclical indicators moving into contraction territory.
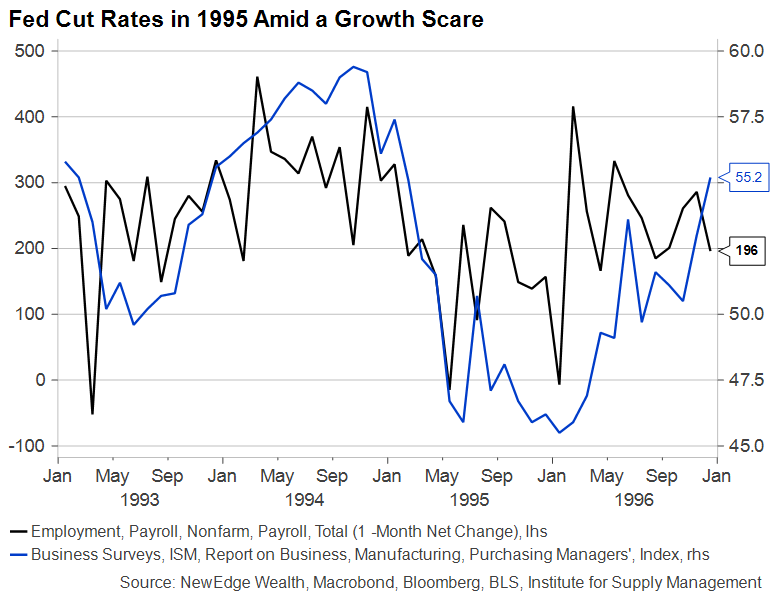
Being attuned to the shifting balance of risks alerted the Fed to the need to tighten policy in 1994 before inflation began to tick higher and to start cutting rates in mid-1995 with inflation still above 3%.
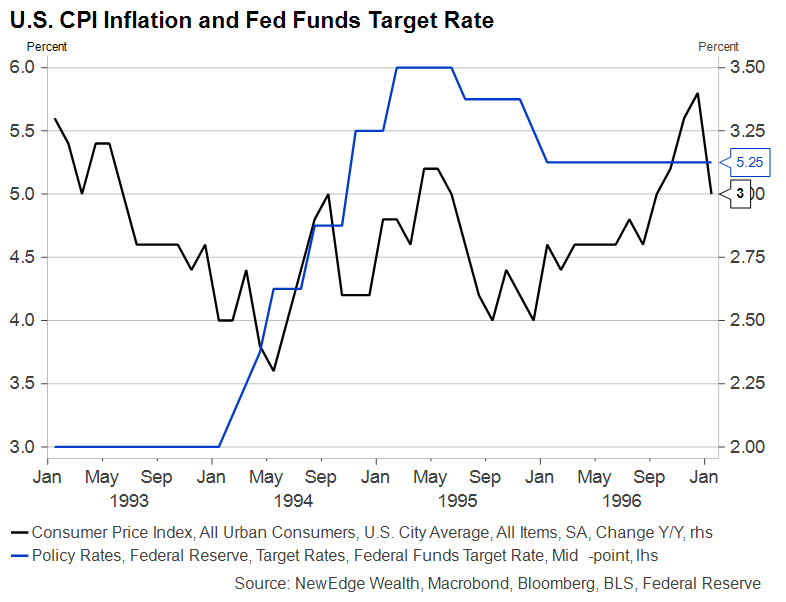
There are significant differences between 1995 and 2024, of course. Inflation never approached its 2022 peak of 9%, nor did rates ultimately climb by the 500+ basis points they have in this most recent tightening cycle. The labor market matters, too. Unemployment never rose significantly in the 1990s as it typically does when the Fed raises rates. In this cycle, it’s already up 0.7% from the bottom, in line with other recent cycles that ended in recessions.
“You can’t run from the revelation”: Should investors party like it’s 1995?
The good news for anyone looking to write an investment playbook for a soft landing is that pretty much every asset class was up in 1995, especially after the Fed’s first cut in July. Core bonds, having just had their worst year in decades, returned nearly 20%. They have not had a better calendar year since.
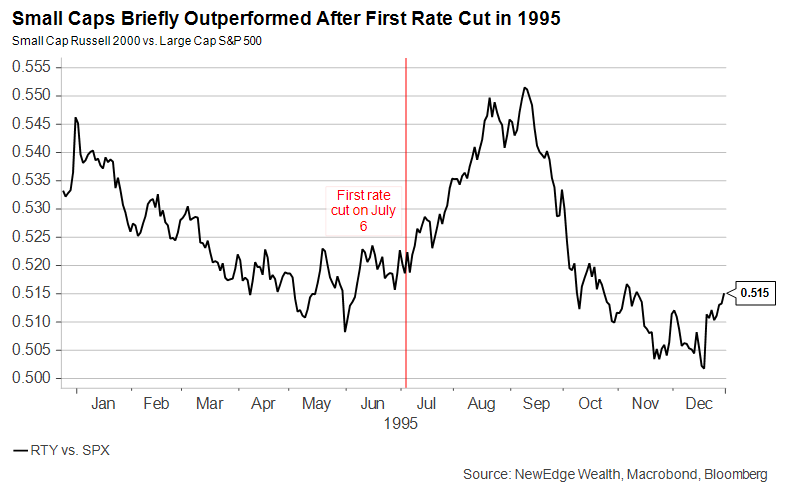
Equity markets returned 25-35% depending on the style, but other than an initial large and sharp small cap rally after the Fed began cutting, large caps consistently outpaced small caps in the quarters following the cuts. This was partly due to the Fed ultimately reducing rates by only 75 basis points during the truncated cycle. A similarly meager offering from today’s Fed could lead to an eventual reversal in the past month’s small cap leadership.
From a sector perspective, while it’s hard to compare the Technology of 1995 to its present iteration, it outperformed leading up to the first cut but gave back those gains once the Fed was in easing mode, ultimately finishing the year just 3% better than the broad index.
While a soft landing in 2024-25 remains a plausible outcome, investors should be cautious about placing too many chips in the best-case basket. There are many ways in which the current period is unlike 1995, most notably the significant rise in unemployment and the much larger rise in interest rates. Former Fed officials and other prominent economists are already chastising the Fed for risking a recession by waiting too long to ease policy, something that few if anyone was arguing in 1995.
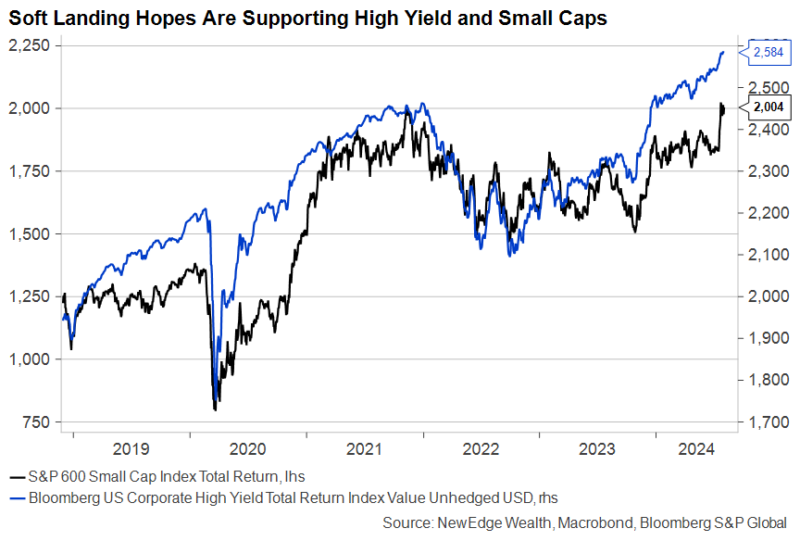
Two asset classes that require a soft landing to sustain their recent run of returns are U.S. High Yield Credit, where we are currently underweight, and U.S. small cap stocks, on which we are currently neutral. Both asset classes have seen a pop in performance since the soft June CPI data, likely because investors have already priced in the benefit of lower rates for both. It will take more rate cuts than what is priced in – so long as they are not conducted to combat a recession – for this tailwind to endure into the Fall.
“Parties weren’t meant to last”: Conclusion
The main reason investors should hold diversified asset allocations is that neither they nor anyone else ever knows precisely what is coming down the path. The best assets to hold are those that will perform well in the likeliest scenario and respectably in the second or third most likely scenarios. Extending duration and increasing quality in bond portfolios fits in the soft-landing playbook, but it also positions investors well in the event the landing becomes a crash.
On the equity side, striking better balance along size, style and geographical dimensions after a period of record return concentration is a prudent way to position for lower rates and continued growth. By trimming the most expensive stocks in a portfolio, investors can avoid some downside in the event the economy overheats again (à la 2022) or swerves into a ditch.
In the very near term, we expect a steeper yield curve to benefit those willing to move out of cash and into intermediate and longer-term fixed income, while anticipation of rate cuts and the Fed’s message about when and how many will arrive will support the recent rotation into small caps and cyclicals. But…no party lasts forever.
IMPORTANT DISCLOSURES
Index Information: All returns represent total return for stated period. S&P 500 is a total return index that reflects both changes in the prices of stocks in the S&P 500 Index as well as the reinvestment of the dividend income from its underlying stocks. Russell 2000 is an index that measures the performance of the small-cap segment of the U.S. equity universe. The Bloomberg US Corporate High Yield Bond Index measures the USD-denominated, high yield, fixed-rate corporate bond market. The S&P SmallCap 600 Index is a stock market index that covers roughly the small-cap range of American stocks, using a capitalization-weighted index. To be included in the index, a stock must have a total market capitalization that ranges from $1 billion to $6.7 billion.
The views and opinions included in these materials belong to their author and do not necessarily reflect the views and opinions of NewEdge Capital Group, LLC.
This information is general in nature and has been prepared solely for informational and educational purposes and does not constitute an offer or a recommendation to buy or sell any particular security or to adopt any specific investment strategy.
NewEdge and its affiliates do not render advice on legal, tax and/or tax accounting matters. You should consult your personal tax and/or legal advisor to learn about any potential tax or other implications that may result from acting on a particular recommendation.
The trademarks and service marks contained herein are the property of their respective owners. Unless otherwise specifically indicated, all information with respect to any third party not affiliated with NewEdge has been provided by, and is the sole responsibility of, such third party and has not been independently verified by NewEdge, its affiliates or any other independent third party. No representation is given with respect to its accuracy or completeness, and such information and opinions may change without notice.
Investing involves risk, including possible loss of principal. Past performance is no guarantee of future results.
Any forward-looking statements or forecasts are based on assumptions and actual results are expected to vary from any such statements or forecasts. No assurance can be given that investment objectives or target returns will be achieved. Future returns may be higher or lower than the estimates presented herein.
An investment cannot be made directly in an index. Indices are unmanaged and have no fees or expenses. You can obtain information about many indices online at a variety of sources including: https://www.sec.gov/answers/indices.htm.
All data is subject to change without notice.
© 2025 NewEdge Capital Group, LLC


