
Weekly Summary: July 12 – 16, 2021
The question should really be, what’s behind many masks? Overall U.S. equity averages such as the S&P 500 have recently exhibited very low measures of volatility, but underneath the surface remains rather elevated volatility between sectors. In a July 12 report, Morgan Stanley’s chief U.S. equity strategist characterized the movements of U.S. stocks as a “rolling correction,” with many sectors and stocks having pulled back 20% or more. Moreover, in a troubling sign, there is an increasing deterioration in breadth as the S&P 500 recently hits new highs. Our previous characterization of global GDP growth for 2021 and 2022—a rolling economic reopening—masks economic growth rates that are rising and falling at different times and relatively more volatile than overall global GDP growth. A steady rise in inflation has also masked great variability in its underlying components. Underlying trends such as wage gains often obscure the uneven effects of the pandemic. Some industries are much more prone to wage gains than others. Some industries experience much stronger price increases due to input costs than others. Likewise, pricing power can vary greatly.
Key observations:
- Overall S&P 500 statistics often mask great dispersions.
- U.S. equities have been making new highs despite rolling corrections.
- Median inflation expectations often mask a great dispersion of underlying expectations. More convergence might be needed before increased inflation expectations can help propel interest rates higher.
- Tight labor markets are making it difficult for both employers and employees to find the right match.
- The Delta variant of the COVID-19 virus could exacerbate labor supply and supply chain issues, which could lower GDP growth rates while increasing inflation. This would be especially true for emerging market countries with low vaccination rates.
The upshot: Overall statistical measures—especially median estimates—must be examined in detail to find their true meaning. In general, the more disparate the data, the less likely they will be to drive market pricing.
Expectations for second quarter S&P 500 earnings
Large first- and second-quarter earnings and revenue gains were projected for the S&P 500. But these gains have been concentrated, masking the dispersion of projected results. Sectors with the biggest such gains often don’t produce corresponding stock price appreciation. The best example may be disappointing stock reactions (either muted or lower prices) to better-than-expected bank earnings and revenue gains. This included this week’s second-quarter results.
According to Goldman Sachs in its July 9 weekly report, financials are expected to be the primary driver of second-quarter EPS growth. That forecast—116% year over year—accounts for 25% of overall S&P 500 EPS growth for the quarter. The other prime example of extreme concentration in the S&P index are the five FAAMG stocks: Facebook, Amazon, Apple, Microsoft, and Google (Alphabet). Together these stocks accounted for 22% of the S&P market cap and 14% of its second-quarter projected EPS. They are expected to grow earnings by an average 52% y/y in the second quarter. According to FactSet’s July 9 report, estimated second-quarter EPS growth for the S&P is expected to be 64% year over year. This would be the second-fastest increase since the fourth quarter of 2009. On March 31, the Q2 increase was expected to be “only” 52.1%. But in terms of percentage changes in their respective EPS increases, financials rank third, followed by tech. Energy is projected to boast the biggest increase for the quarter, followed by materials.
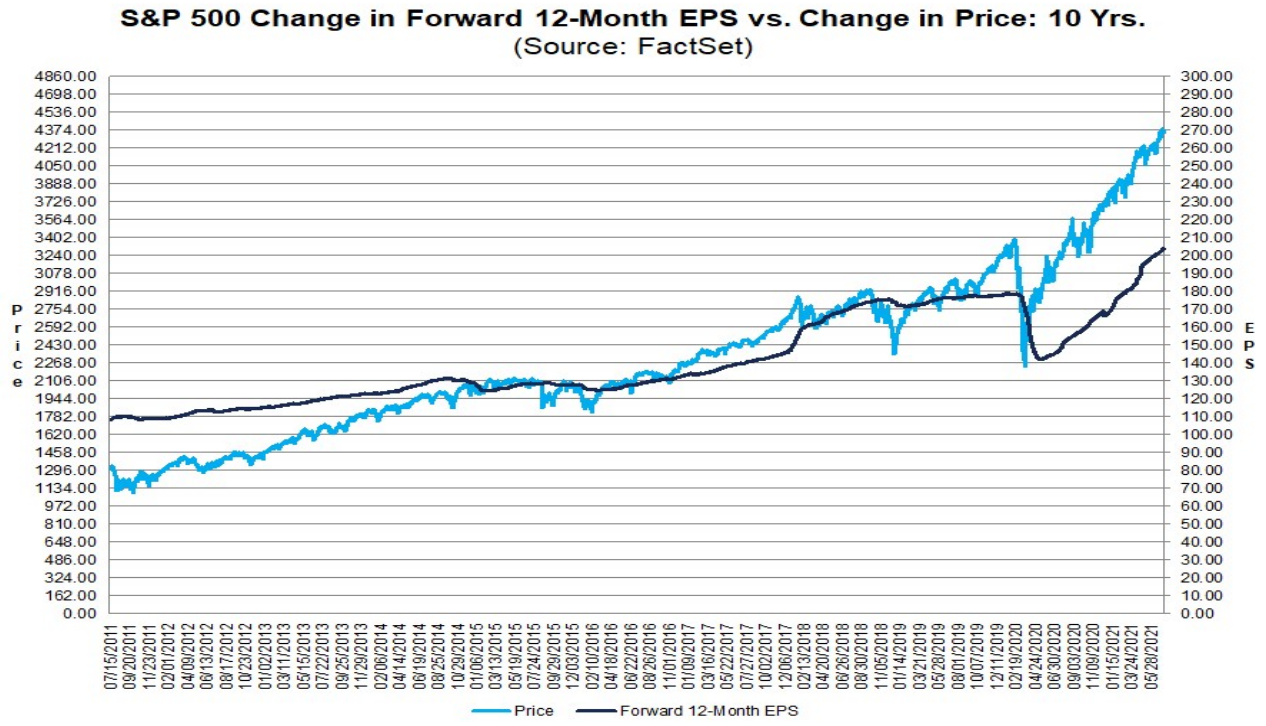
Source: FactSet – Earnings Insight (7/16/21)
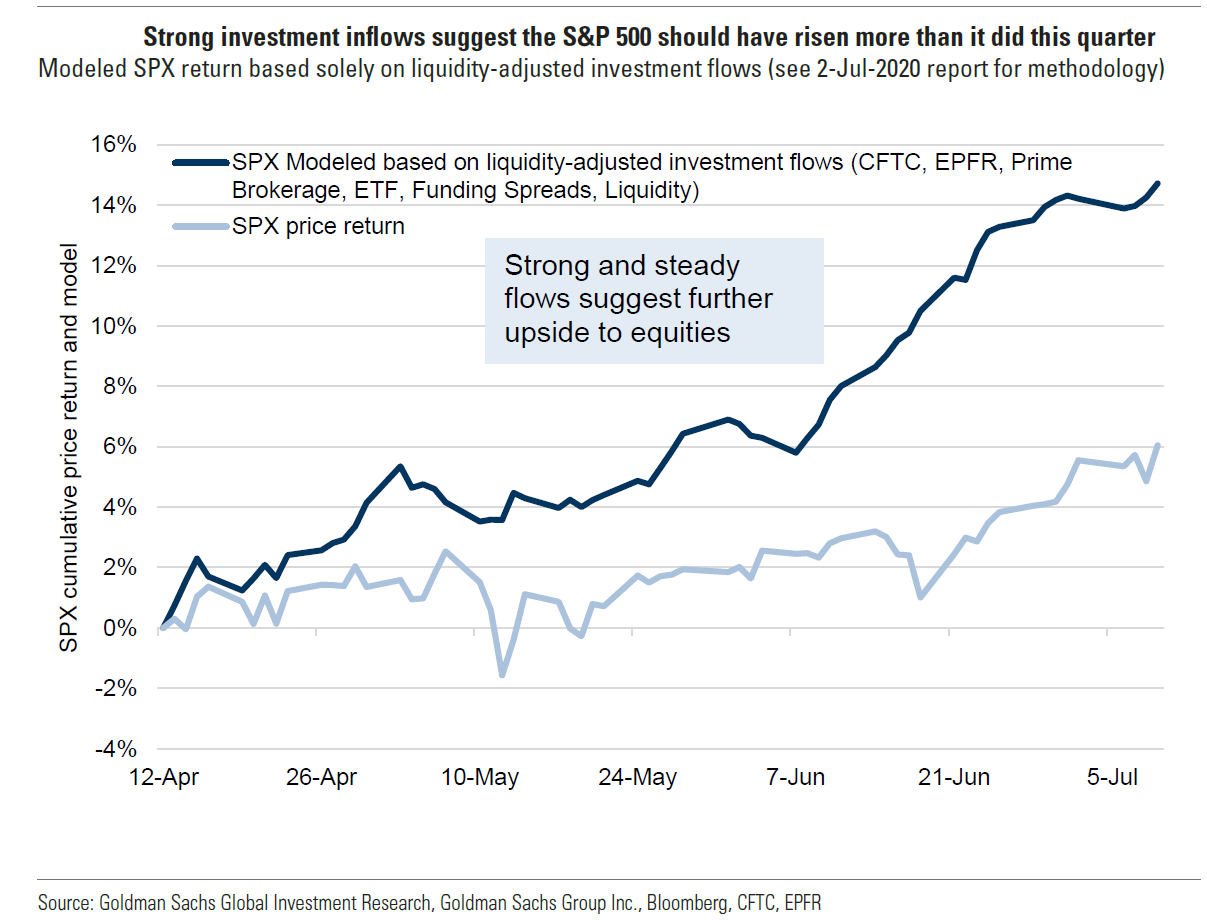
Source: Goldman Sachs – Top 25 Tactical Trades for Earnings Season (7/12/21)
Comparing Q1 and Q2 trends
The first quarter of 2021 was characterized by value and cyclical stocks outperforming amid rising interest rates. By contrast, Q2’s best performing stocks were generally more defensive, including big-cap, high-quality growth stocks in a generally declining interest rate environment. The quarter also saw deteriorating breadth, as stock gains became more concentrated. Thus it was not surprising that on July 9, Citi Research observed that only 10% of S&P stocks “soundly” beat the index in Q2. In contrast, over 35% of S&P stocks could make that claim in Q4 2020, and over 30% could do so in Q1.
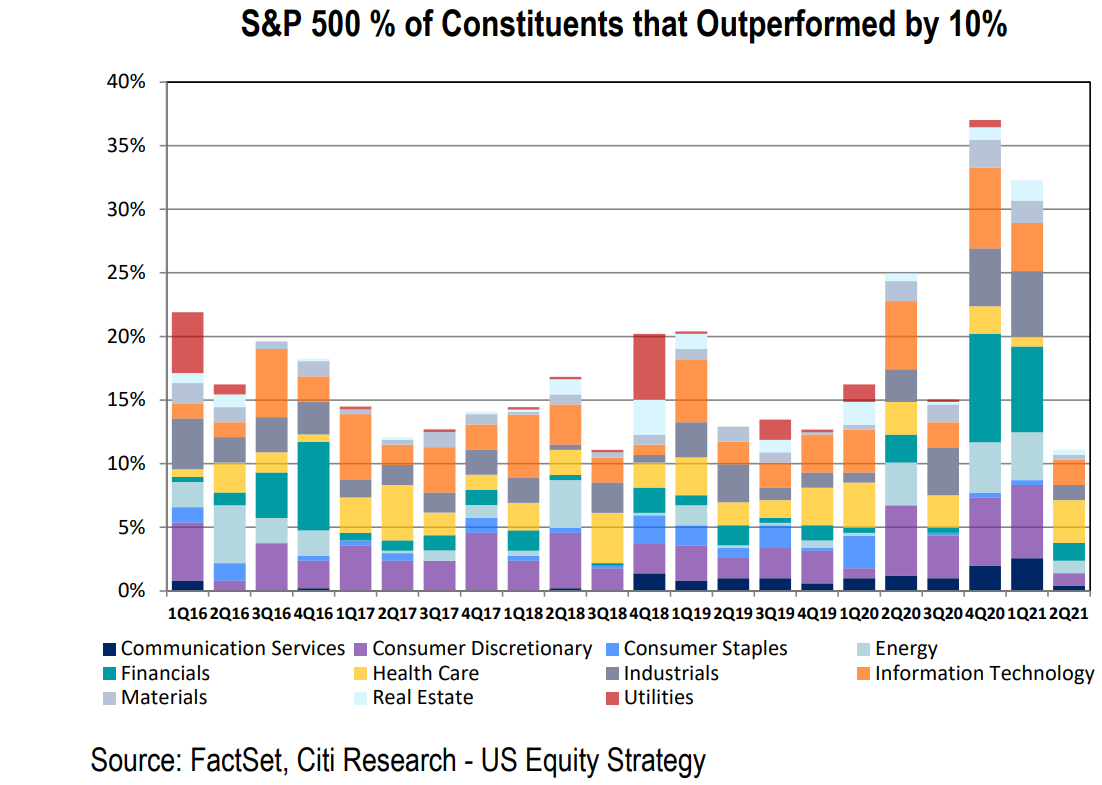
Source: Citi – Monday Morning Musings: Pondering Perspectives of the Past Year (7/9/21)
These latter two quarters encapsulated the “reopening, reflation” trade, when Value and cyclical stocks outperformed in a more broad-based advance. According to a Citi report (July 12), about 80% of S&P 500 stocks had positive earnings surprises in the first quarter, but positive surprises were usually met with muted stock price reactions—whereas negative surprises were “punished.”
Unfortunately, the very early indication of Q2 reactions exhibit a similar pattern—at least for bank stocks. On July 13 JPMorgan said that those stocks now trade at 1.4 times tangible book value, far below the long-term average of 2 times. Over the past two months the bank index (BKX) was down 2.3% (vs. a gain of 7.9% for the SPX), underperforming S&P 500 by 10.2%. This has often been characterized as a de-risking period. Despite the week’s many disappointing bank stock reactions, perhaps it is time to revisit buying bank stocks, especially as interest rates show signs of bottoming. The rather “crowded’ trades in cyclical and Value stocks have also become less so in Q2.
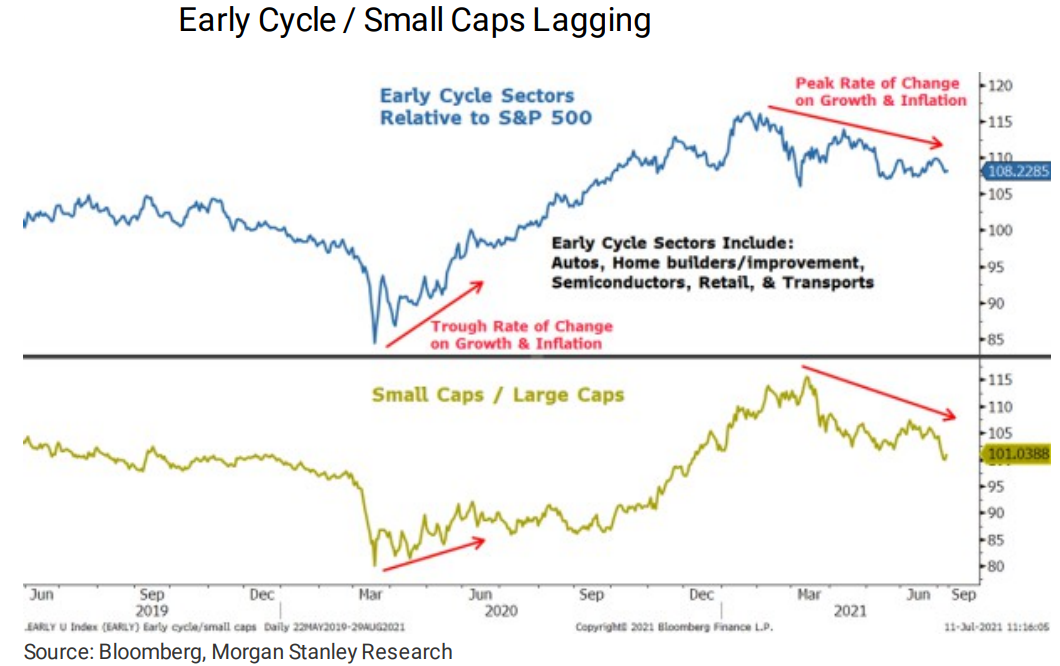
Source: Morgan Stanley – US Equity Strategy: Weekly Warm-up: What’s Next in the Rolling Correction? (7/12/21)
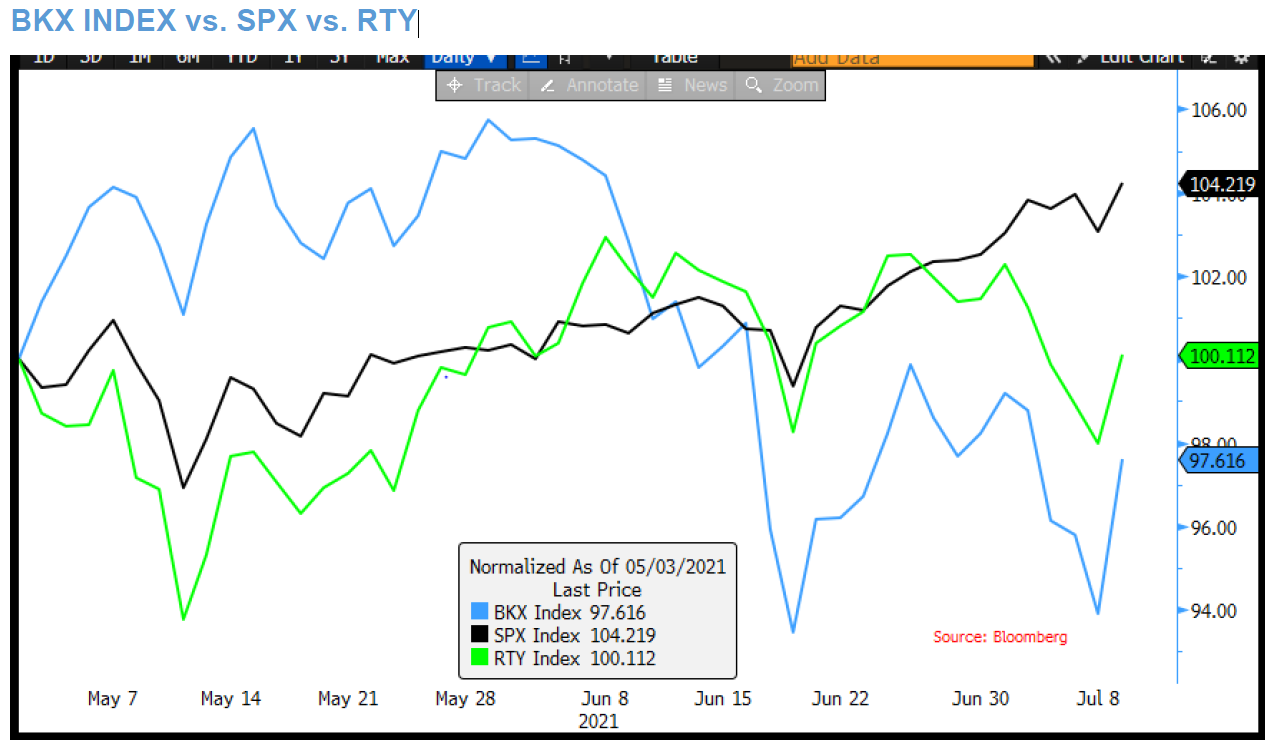
Source: J.P. Morgan – US MARKET INTELLIGENCE: MORNING BRIEFING (7/12/21)
Recent drivers of stock performance
According to its July 9 report Goldman Sachs’ models showed that profit margins were the second most important determinant of stock valuations, behind only equity ”duration” (stocks with more predictable and increasing earnings). The better performance of quality growth stocks, at least since early June, partially substantiates this claim. According to BlackRock’s 2021 midyear outlook, technology, pharmaceutical/healthcare and luxury goods makers appear best positioned to pass on higher input costs and maintain their relatively high profit margins.
Yet another example of the need to look behind the mask is that S&P companies’ cash balances are not evenly distributed but are highly concentrated. The info tech and consumer discretionary sectors possess the highest proportion of cash/asset ratios of any sectors and account for 43% of total S&P (excluding financials) cash balances.
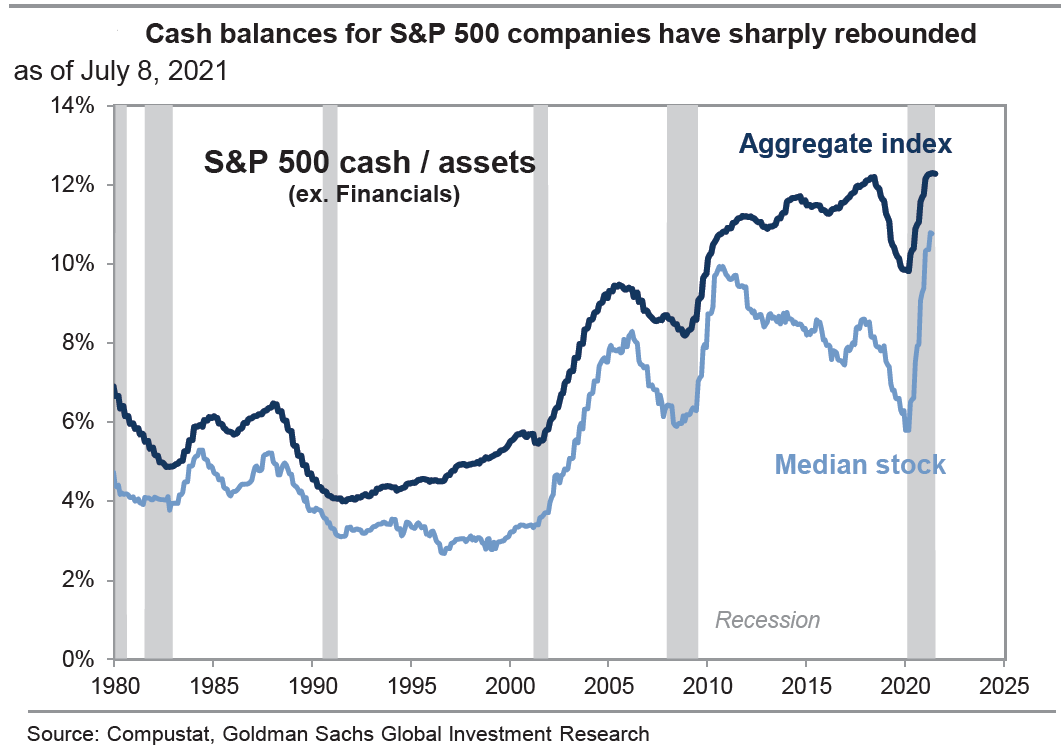
Source: Goldman Sachs: US Weekly Kickstart (7/9/21)
Sustainability of earnings increasingly questioned
As always, stocks trade on anticipated future revenue and earnings estimates. Even extreme “beats” on EPS and revenues lose their significance unless somewhat sustainable impressive results can be expected. But many investors have recently begun to question the durability of the reopening/reflation trade. In a relatively short period, investors have gone from worrying about an overheating economy and runaway inflation to being concerned about the economy’s sustainability.
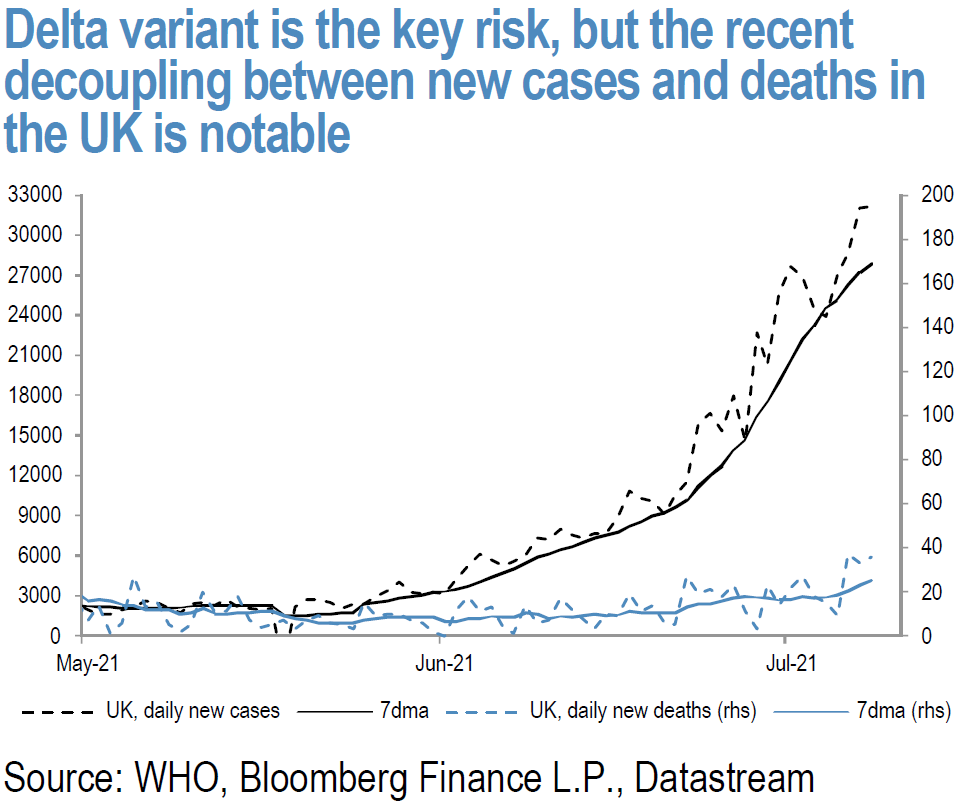
Perhaps the most important worry among the factors influencing these views has been concern over the ever-increasing spread of the Delta variant, which now accounts for nearly 100% of new coronavirus cases in the U.K. and is generally increasing greatly elsewhere. But hospitalizations have mostly been avoided for those who have been fully vaccinated.
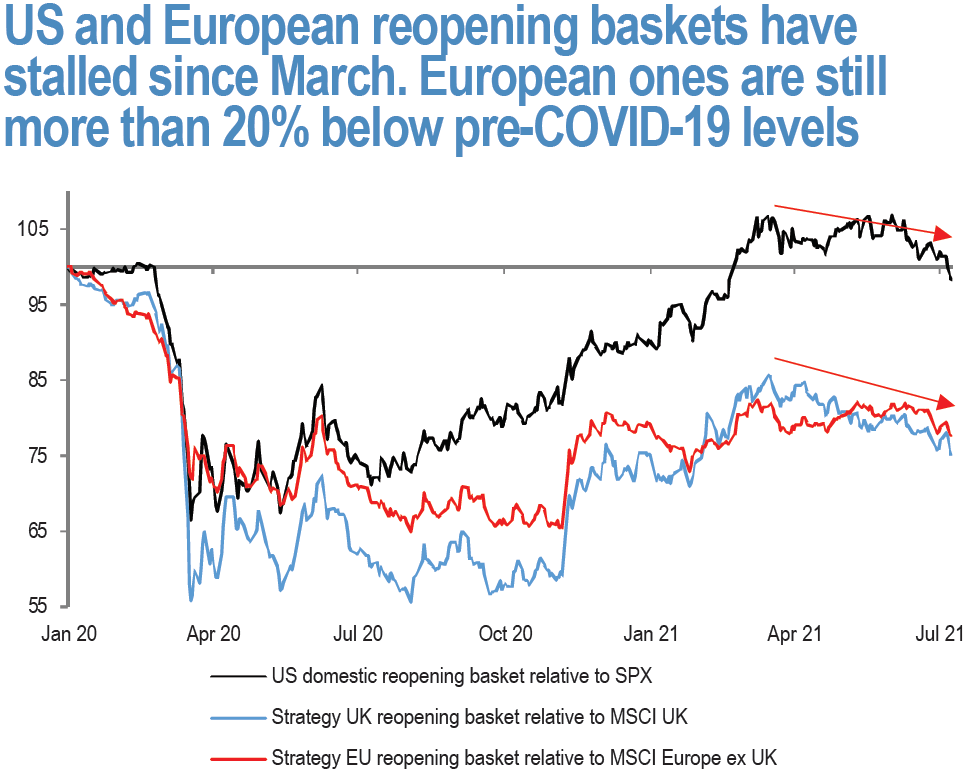
Source: J.P. Morgan – European Consumer Reopening (7/12/21)
Source: J.P. Morgan – US Weekly Prospects (7/9/21)
Among other factors that have led to questions about maintaining Value and cyclical holdings: weaker than expected economic data (but often caused by supply and labor shortages); the Delta variant’s effect on emerging markets (EMs) due to their lower current vaccination rates; possibilities of new coronavirus restrictions in the fall as variants proliferate; slowing if still robust economic growth rates; and the possibly transitory nature of inflation and even economic growth.
The unexpected decrease of the employment index in the latest ISM survey (a monthly indicator of U.S. economic activity), announced last week, was also a concern. But we believe that:
- This mostly reflected employers’ continuing difficulties in finding qualified workers.
- Many of these concerns are at least partially reflected in current market prices.
- Investors should selectively take advantage of the lowered prices of Value and cyclical stocks, while maintaining exposure to more predictable earners such as big-cap quality growth stocks.
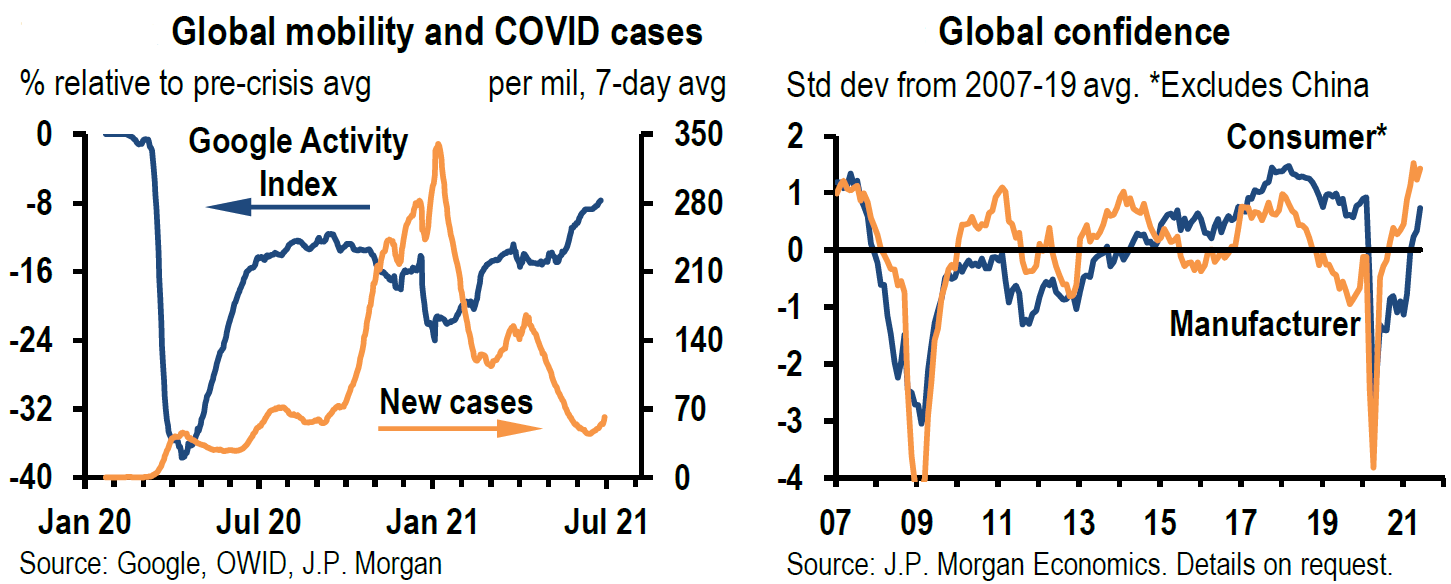
Although the Delta variant has slowed reopenings and economic growth in many countries, it has not derailed them. In a July 12 report, JPMorgan noted that not only will aggressive vaccine rollouts in emerging markets continue; in many cases they are ahead of schedule. That should help accelerate positive mobility trends once again. Investors have probably discounted lower mobility rates already. We believe that the Delta variant (and possibly others) will serve to further extend global economic growth. Moreover, such variants will actually increase inflationary pressures due to a rise in labor shortages related to the Delta variant, and decrease economic growth rates for similar reasons. The great divergence of investor opinions on inflation and economic growth will probably limit the near-term upside for equity averages. What happens underneath the averages, of course, is another matter.
Good economic growth and higher-than-expected inflation
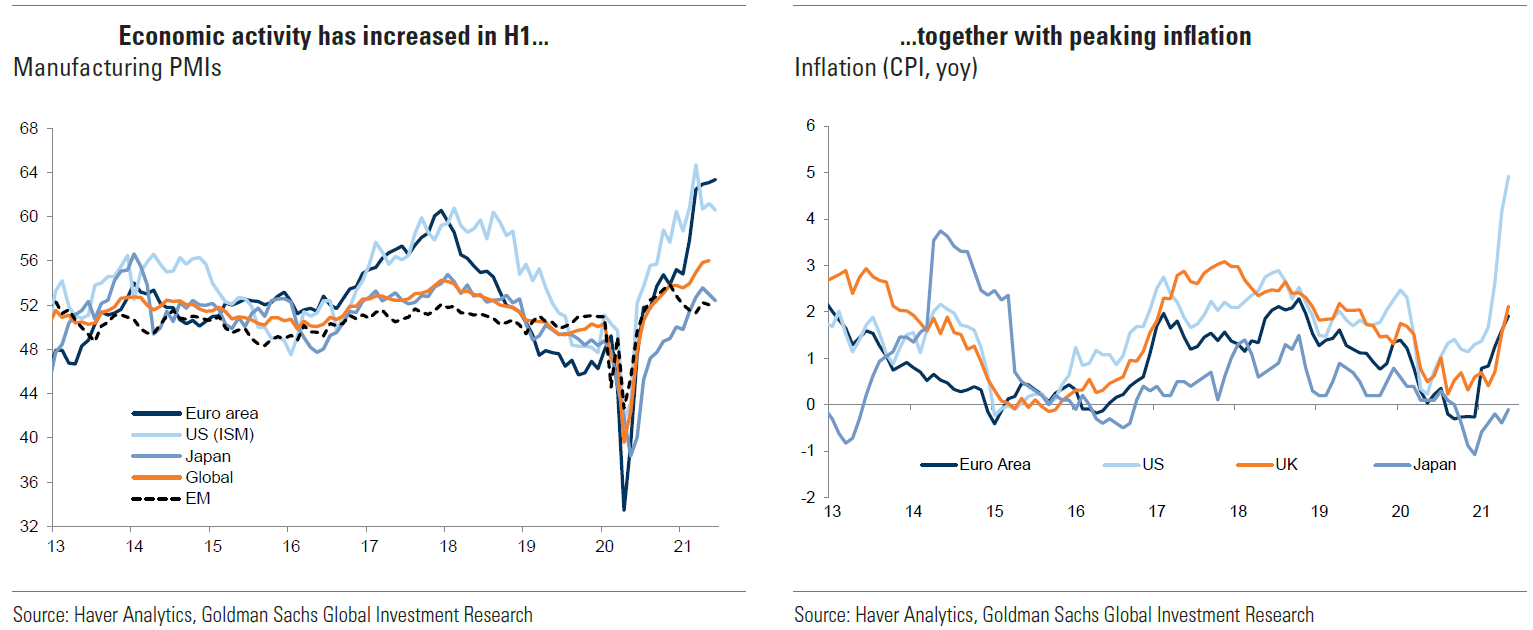
The recent economic and inflation patterns persisted this week. The U.S. June CPI and PPI figures exceeded expectations in both the headline and core readings. Some of these increases were greatly affected by pandemic-influenced shutdowns, supply chain disruptions, and other shortages including labor. But other, more persistent components, such as shelter costs, also contributed to the unexpected price gains in measures of inflation. According to CNBC’s July 13 report, 48% of small businesses were able to raise prices in May—the biggest percentage to do so in 40 years. CNBC added that a recent Bank of America survey showed that professional investors are more inclined to believe that inflation will be temporary. But most consumers continue to expect higher inflation. The continued increases in U.S. import prices for June, released by the U.S. Bureau of Labor Statistics this week, further adds to inflationary pressures. Import prices rose 1% m/m in June vs. a 1.4% increase in May. Prices for overall imports rose 11.2% for the year ended June.
The unexpected decrease in the University of Michigan’s preliminary U.S. consumer sentiment index for the first half of July showed that increasing inflation expectations can dampen sentiment. This sentiment index fell to 80.8 (lowest since February) from a final reading of 85.5 in June vs. an expected reading of 86.5. Gauges of current economic conditions and expectations were also negatively affected as inflation became more of a concern. According to Michigan’s survey director “consumers’ complaints about rising prices on homes, vehicles, and household durables has reached an all-time record.” The survey’s one year inflation expectation rose to 4.8% from June’s expected 4.2% rate. The 5-year outlook for inflation rose to 2.9% from 2.8%. Evidently, many consumers are beginning to feel the effects of inflation.
According to a JPMorgan July 12 report, the global composite PMI (an index of economic trends) decreased by 1.8 points in June, to 56.6, remaining in an expansionary mode and significantly above trend. This figure was impacted negatively by recent dips in U.S. and China PMIs but positively by the Eurozone’s increasing PMI data. The June Markit composite PMI for the U.S. receded from a record high in May to its second-highest level in June, as both manufacturing and services sectors slipped. U.S. production was hampered by significant supply delays and labor shortages. The decrease in China’s Caixin composite PMI had a similar explanation. Meanwhile, the EU Markit composite PMI rose 2.4 points in June to a near record high. The EU composite June numbers reflected the service sector’s fastest month-over-month growth in 15 years, mostly due to increased vaccinations and broader reopenings.
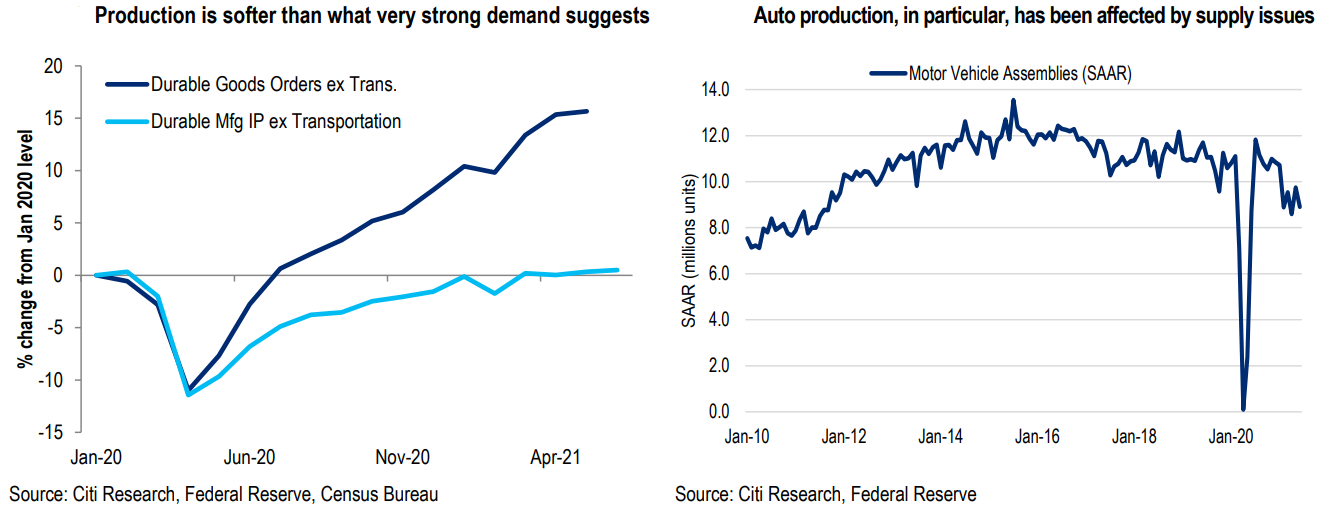
The Fed’s release of U.S. industrial production statistics, although still very positive, showed similar distortions due to continuing pandemic related issues. U.S. industrial production rose 0.4% m/m in June vs. an expected increase of 0.6%. But June’s manufacturing output decreased by 0.1%, as an ongoing shortage of semiconductors contributed to a decrease of 6.6% in the production of motor vehicles and parts. Better than expected U.S. June retail sales of 0.6% m/m were similarly negatively impacted. Excluding automobiles, gasoline, building materials and food services, retail sales increased by 1.1%.
But perhaps the most encouraging economic news of this week came from the New York Fed’s Empire Manufacturing Survey, conducted between July 1 and July 9. This survey’s statistics are compiled from about 200 manufacturers in N.Y. state. The headline general business conditions index rose by a dramatic 26 points to a record high 43.0 vs. an expected reading of 18. Other notable features of the survey included strong employment gains, sharply rising input prices and selling prices that rose at the fastest pace on record. There was an equally impressive increase in both orders and shipments.
Source: Citi – US Economics The Daily Update (7/15/21)
Source: Goldman Sachs – Strategy Espresso: 2021 H1 recap: the first leg of the recovery (7/8/21)
Source: Citi – US Economics: Somewhat softer manufacturing on headwinds from supply (7/15/21)
Views of small U.S. businesses
The NFIB survey of small businesses reported similar findings this week: The NFIB’s business optimism index rose to over 100 for the first time since November 2020, but its uncertainty index rose as well. While the level of those expecting better business conditions over the next six months rose by 14 points, the result still was a very negative -12. Nearly half (46%) of small business owners reported that job openings could not be filled, and a record net 28% of owners planned to create new jobs.
Meanwhile, the 40% of businesses who reported job openings for skilled workers remained the same as in May, but only 22% (down five points from May) reported job openings for unskilled jobs. As the labor market has tightened, many jobs have been filled through hiring people who were already employed elsewhere. A record-high 39% of small businesses said they raised wages in June, and a net 26% intend to raise compensation levels in the next three months. Labor quality remained the top overall issue, with more than one quarter (26%) of businesses expressing concerns. But perhaps most troubling was that 56% of small business owners reported capital expenditures over the past six months, a decrease of 6% from May. Could this be related to the difficulty in hiring qualified workers?
Potential employees also have trouble finding jobs
Evidently employers’ difficulty in finding qualified employees is not a one-way street. In most recoveries—including January 2011–February 2020, the period after the “Great Recession”—jobs become easier to find as the labor market tightens. But on July 9, JPMorgan reported that the current recovery has deviated from that pattern. This time around, as labor markets have tightened, the job-finding rate has fallen. Indeed, that rate has been consistently below expectations. Perhaps as economic digitization has accelerated during the pandemic, there has been a mismatch of qualified workers to the new jobs available.
Exacerbating this trend is that digitization may have been greatly responsible for improved productivity in many industries, resulting in fewer employees needed for the same amount of output. On July 12 Goldman Sachs noted a persistent increase in productivity—about 3.1% annual growth since the start of the pandemic vs. a 1.4% rate in the previous business cycle. Not surprisingly, such productivity gains have been most pronounced in industries where virtual meetings are feasible and in-person expenses like travel and entertainment could be diminished.
Goldman highlighted the industries that benefited most from such trends: Information technology had the greatest productivity gains, followed by professional services, product development/wholesale trade, and retail. Both the mismatch of qualified workers to available jobs and less need for workers in selected industries will make it more difficult to see very low rates of employment. Since one of the Federal Reserve’s principal goals is to reduce inequality through very low unemployment, expect it to attempt to remain as accommodative as possible, relative to the economic and inflation data it receives.
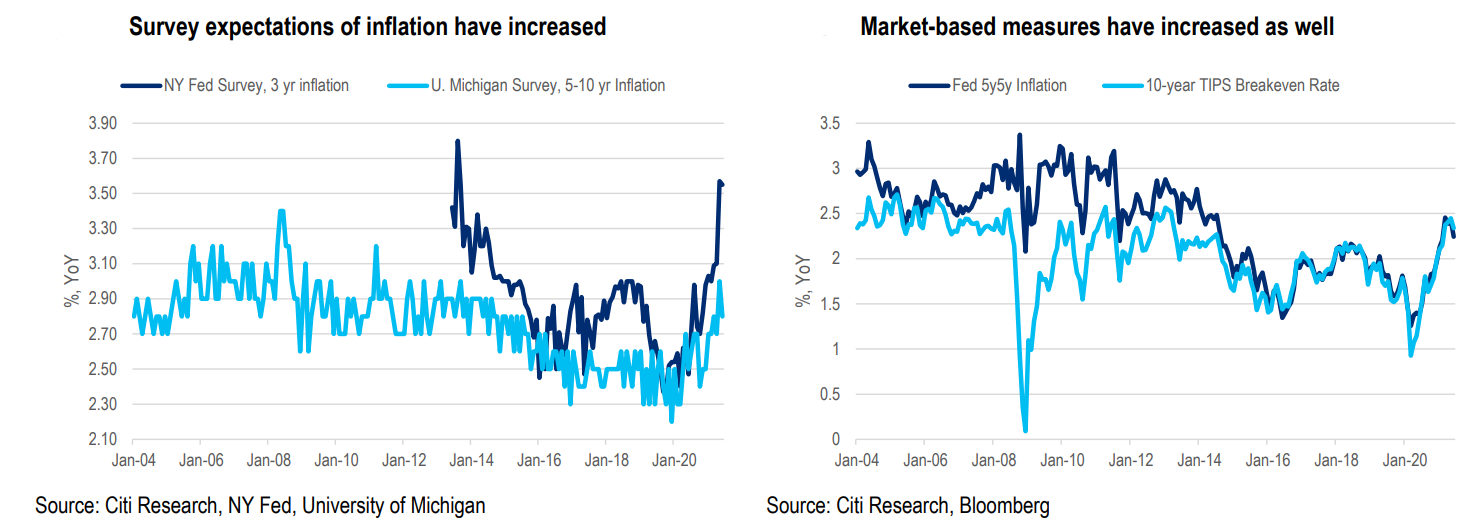
Dispersion of inflation expectations vs. median expectations
Another reason for at least measured optimism about Value and cyclical positions as economies reopen and reflate: Consumers’ expectations for inflation remain buoyant, which should translate into higher intermediate and long term-interest rates at some point. The New York Fed’s June survey of consumer expectations, released this week, revealed that consumers’ median short-term (one year) inflation expectations rose by 0.8% to 4.8%—a series high. (This increase came mostly from respondents with at least some college education.) Inflation expectations for the next three years remained at 3.6%.
Other key consumer expectations: Higher unemployment is less likely; perceived risk of job loss is at record lows; wage growth will increase over the next year (particularly expected among college-educated respondents). Expectations for median household income growth rose across all categories, but increased spending expectations were most pronounced among the college educated.
All of these expectations reflect the median—but median numbers often mask great dispersions. This is especially true with regard to inflation expectations: The June gap between the 75th and 25th percentiles was the widest ever in the series. While the dispersion of inflation expectations continues to increase, it is, of course, completely hidden by median numbers. Perhaps such expectations need to converge before they can affect interest-rate movements.
Global central banks’ inclination to hike interest rates
There appears to be an increasing divergence of opinion among global central banks as well. Admittedly there are great regional differences. Nevertheless, it is rather likely that some central banks might view inflation as more persistent. According to JPMorgan’s July 9 report, many central banks are expected to start hiking rates much sooner than major ones, including the Fed, the European Central Bank, the Bank of Japan and the People’s Bank of China Even though the number of positive economic surprises has narrowed, JPM’s economists expect 34% of global central banks to hike rates by March 2022; this expectation is up from 19% at the start of this year. Moreover, for one-quarter of the banks, the magnitude of interest-rate hikes has been revised higher. The largest increases are expected in Latin America and the EMEA (Europe, Middle East and Africa). The latter includes Russia, the Czech Republic, and Hungary.
Economic and inflation data continue to have unpredictable effects on financial markets
High inflation numbers this week continued to have little impact on interest rates. So, what drove rates higher when higher-than-expected CPI was announced—but lower when higher-than-expected PPI was announced? Interest rates initially fell on the CPI announcement date, only to reverse and finish higher that day due to a very disappointing $24 billion auction of 30-year U.S. Treasuries. On the day PPI was announced, rates started—and continued—to fall, mostly due to Fed chairman Jerome Powell’s dovish congressional testimony. Higher-than-expected inflation data was simply viewed as “noise.”
In this high inflation environment, the S&P 500 was relatively stable the first four days of this week. But sector performance continued to show much more day-to-day variability. Although it was mixed overall, it favored defensive stocks. Even so, daily performance varied among the S&P 500, Dow, Nasdaq and Russell 2000, the worst performer during this period.
Bottom line
Concentration of earnings and revenue growth must be fully understood before we can make a proper assessment of the future trajectory of the S&P 500 index. The financial sector’s earnings magnitude and the FAAMG stocks’ outsize impact have a disproportionate effect on S&P 500 performance measures. To better determine specific P/E ratios and revenue growth of various sectors and stocks, those effects probably should be factored out.
Since they are obviously included in overall trends, the uneven effects of the pandemic often mask divergences between sectors’ and specific companies’ margin pressures and pricing power. This is especially true for wage gains. The Delta COVID-19 variant could have an increasing impact on both production and inflation measures. The longer inflation pressures persist, the more likely they are to become the expected norm.
As median inflation expectations have increased, so has the dispersion of inflation expectations. This may partly explain why inflation statistics that have repeatedly exceeded expectations seem to have no effect on interest rates. Perhaps only when such expectations converge will they exert pressure on interest rates. In the meantime, the Fed appears to be able to control rates through continued dovish rhetoric and a reluctance to tighten monetary policy. Will the Fed’s belief in the transitory nature of inflation continue to keep inflation expectations widely dispersed, or will inflation expectations converge despite the Fed’s rhetoric and inaction?
Index Definitions:
VIX: The VIX Index is a calculation designed to produce a measure of constant, 30-day expected volatility of the U.S. stock market, derived from real-time, mid-quote prices of S&P 500® Index (SPX℠) call and put options.
Russell 1000 Value: The Russell 1000 Value Index measures the performance of the large-cap value segment of the U.S. equity universe. It includes those Russell 1000 companies with lower price-to-book ratios and lower expected and historical growth rates.
Russell 1000 Growth: The Russell 1000 Growth Index measures the performance of the large-cap growth segment of the U.S. equity universe. It includes those Russell 1000 companies with higher price-to-book ratios and higher forecasted and historical growth values.
NASDAQ: The Nasdaq Composite Index is the market capitalization-weighted index of over 2,500 common equities listed on the Nasdaq stock exchange.
S&P 500: The S&P 500 Index, or the Standard & Poor’s 500 Index, is a market-capitalization-weighted index of the 500 largest publicly-traded companies in the U.S.
MSCI EM Value Index: The MSCI Emerging Markets Value Index captures large and mid cap securities exhibiting overall value style characteristics across 27 Emerging Markets (EM) countries
MSCI EM Index: The MSCI Emerging Markets Index captures large and mid cap representation across 27 Emerging Markets (EM) countries
KBW Nasdaq Bank Index (BKX): The KBW Bank Index is designed to track the performance of the leading banks and thrifts that are publicly-traded in the U.S. The Index includes 24 banking stocks representing the large U.S. national money centers, regional banks and thrift institutions
IMPORTANT DISCLOSURES
The views and opinions included in these materials belong to their author and do not necessarily reflect the views and opinions of NewEdge Capital Group, LLC.
This information is general in nature and has been prepared solely for informational and educational purposes and does not constitute an offer or a recommendation to buy or sell any particular security or to adopt any specific investment strategy.
NewEdge and its affiliates do not render advice on legal, tax and/or tax accounting matters. You should consult your personal tax and/or legal advisor to learn about any potential tax or other implications that may result from acting on a particular recommendation.
The trademarks and service marks contained herein are the property of their respective owners. Unless otherwise specifically indicated, all information with respect to any third party not affiliated with NewEdge has been provided by, and is the sole responsibility of, such third party and has not been independently verified by NewEdge, its affiliates or any other independent third party. No representation is given with respect to its accuracy or completeness, and such information and opinions may change without notice.
Investing involves risk, including possible loss of principal. Past performance is no guarantee of future results.
Any forward-looking statements or forecasts are based on assumptions and actual results are expected to vary from any such statements or forecasts. No assurance can be given that investment objectives or target returns will be achieved. Future returns may be higher or lower than the estimates presented herein.
An investment cannot be made directly in an index. Indices are unmanaged and have no fees or expenses. You can obtain information about many indices online at a variety of sources including: https://www.sec.gov/fast-answers/answersindiceshtm.html or http://www.nasdaq.com/reference/index-descriptions.aspx.
All data is subject to change without notice.
© 2021 NewEdge Capital Group, LLC


