Well, I heard it all before, so don’t knock down my door
I’m a loser and a user so I don’t need no accuser
To try and slag me down because I know you’re right
‘Cause you know where I’ll be found
“When I Come Around” – Green Day
This week we are providing our assessment of the U.S. small and mid-cap equity market, a universe of nearly 2,500 listed companies that are generally classified as having market capitalizations from $50M to $30B and have traditionally represented about 20% of the total U.S. equity market cap.
Historically, this market segment has produced average annual outperformance relative to the large cap segment of about 40bps over the past four decades, however over the last several years we have seen some of the largest underperformance from the small and mid-cap segment on record, coinciding with a wave of negative sentiment and outflows. All of this leads us to ask the question: what could cause this market segment to come around?
“I heard you crying loud”: Small Caps’ Lagging Performance
Since peaking in late 2021, the small & mid cap (SMID) market has endured a challenging run of performance, driven by the well-documented headwinds of higher interest rates, sluggish economic activity, and persistent pressures on profitability. As a result, SMID equities, as measured by the Russell 2500 Index, have generated cumulative underperformance relative to the large cap S&P500 Index of -24%, or about -8% annualized over the last two and a half years. Furthermore, as of the end of May, the Russell 2500 Index remains about -9% below its 2021 peak, while the S&P500 has recently notched new all-time highs and has surged more than 12% above its 2021 peak.
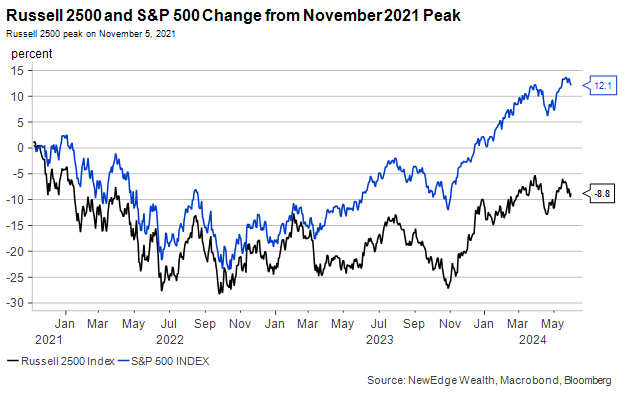
While we have seen periods of improving market performance outside of the largest tech names in 2024, large cap equities have reasserted their dominance in recent weeks, extending their YTD outperformance vs. SMID equities to nearly 8%.
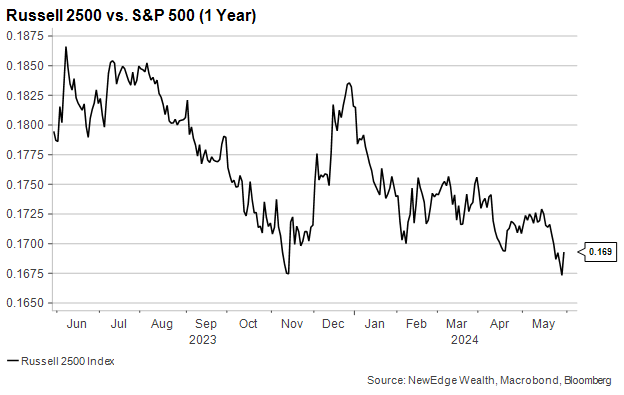
This differential has been fueled by robust earnings growth from the largest S&P500 index constituents who have benefited from economies of scale, lower debt service costs, and continued operational efficiencies. These factors have also been amplified by the acceptance that we are likely in for a higher for longer interest rate environment, which could act as an anchor on SMID cap returns. As a result, the ratio of SMID cap to large cap performance touched an all-time low in recent weeks, extending a long downtrend that began more than 10 years ago.
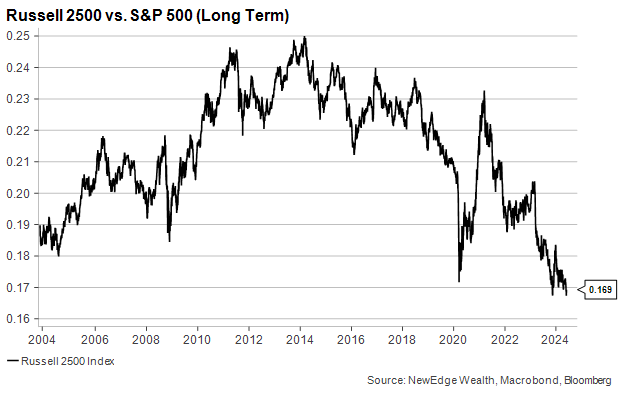
At NewEdge we have recommended investors maintain a bias for large caps over small and mid-cap equities since 2021, a stance we reiterated at the beginning of this year, despite the widely held consensus view that 2024 would be the year that small and mid-cap equities would finally come around.
Today, we continue to hold this large over small preference within U.S. equities, however we recognize that we may be in the later innings of this positioning, given this historic underperformance of SMID cap equities. While the timing for a turn in relative performance is still uncertain, ultimately, there are three main factors that could drive SMID cap equity outperformance sometime in the future: a supportive macro environment, a recovery in earnings growth, and a turn in momentum and concentration.
“Well, I heard it all before”: Key Factors that Could Support SMID Cap Equity Outperformance
1. A Supportive Macro Environment
• Broadly small and mid-cap companies have relied more on debt financing than their large cap peers, using increased borrowing to invest in and fuel growth, which results in higher interest expenses and average debt ratios that are 50% higher than their large cap peers. In addition, roughly 40% of debt issued by SMID companies is floating rate, 3x the level of floating rate debt at large caps, making SMID interest expenses more correlated to prevailing interest rates.
• As market watchers and the Fed consider the prospect of beginning rate cuts, this interest rate sensitivity may turn from a headwind to a modest tailwind, assuming these lower rates are not in response to a substantial deterioration in economic activity. Historically, rate cuts have been supportive of SMID equity performance as during six prior rate cutting cycles, which have lasted anywhere from several quarters to several years, SMID equities have generated cumulative average returns of 31% vs 24% for large caps.
• SMID companies have also historically been more economically sensitive than their large cap peers given the fact that 80% of SMID revenues are sourced domestically. In addition, the SMID segment has a more cyclical orientation and includes greater exposure to earlier lifecycle businesses, which are largely driven by healthy economic activity. If the U.S. economy is able to transition from the current late cycle environment to an early cycle expansion, this cyclicality may become a tailwind, however investors will have to balance the dynamics of interest rate sensitivity and economic sensitivity when considering the future path of SMID cap performance.
2. An Earnings Reacceleration
• Earnings growth is the primary driver of long-term performance in equities and in the SMID segment earnings growth has been lackluster at best for the past two years. Aggregate earnings for the Russell 2500 Index have declined on a T12 basis for 7 of the last 10 quarters, and earnings in this segment remain -14% below their 2022 peak levels.
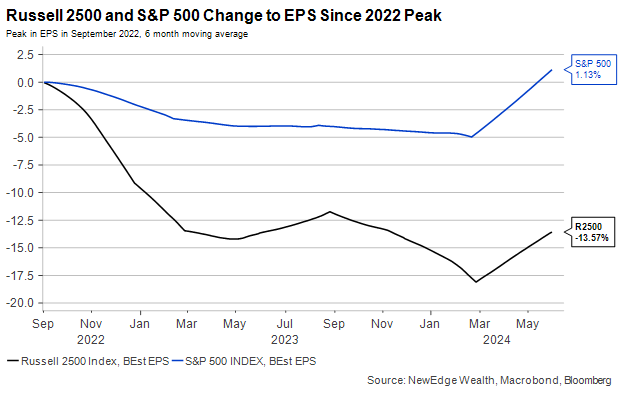
• The main culprit behind this earnings weakness has been declining profitability as aggregate operating margins in the index have shrunk from over 9% to just 6% over the past two years, offsetting revenue growth of more than 15%, largely a result of increased wage and interest expenses. For SMID cap performance to rebound, better margin performance is likely required (currently this recovery in profitability is anticipated as illustrated in the below chart), while the silver lining to the recent weak performance is that it creates easy comparisons growth going forward. Interestingly, we may see the inverse effect in the large cap segment as tougher YoY comparisons could weigh on future earnings growth, especially in the largest index constituents, which have delivered incredible EPS growth in the past two years but are expected to see a marked deceleration in this growth in 2025.

3. Peaking Large Cap Concentration & Momentum
• The U.S. large cap equity market is more concentrated today than it has been at any point in history, mainly due to the recent outsized performance from the largest constituents and a lack of growth in the vast majority of index names. Today, the top 5 companies in the S&P500 account for 28% of the index weight, exceeding the 2020 peak of 24%, and the dot com bubble peak of 18%. Meanwhile the momentum factor has outperformed by an astounding 7% this year, reflecting herd investor behavior and continued bullish sentiment towards the best performing names.
• We can’t say when this extreme concentration will turn, but in prior instances when this level of concentration has peaked SMID equities have generated healthy performance. In the summer of 2000 for example, following peak large cap equity concentration, the Russell 2500 Index subsequently generated cumulative five year returns of 41%, while the S&P500 declined by -13% over the same period.
“’Cause you been searching for that someone”: Value in Current Valuations?
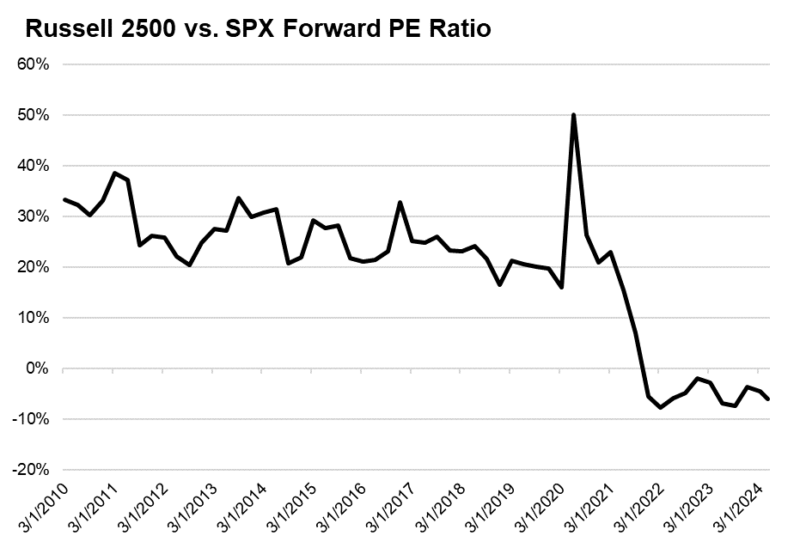
While valuation is typically a poor market timing tool, we acknowledge that there remains an opportunity to invest in the SMID segment at more attractive valuations than large caps especially when factoring in currently depressed and potentially reaccelerating earnings. The U.S. large cap segment, measured by the S&P500, currently trades at 19x 2025 earnings estimates, 5% above its 10-year average forward P/E, while the Russell 2500 Index currently trades at 16x 2025 earnings estimates, a 20% discount to its 10-year average forward P/E. We see a similar story in Price to Book Value metrics, as the Russell 2500 Index currently trades at 2.3x Book Value, in line with its 10-year average, while the S&P500 currently trades at a near record 4.8x Book Value, a 30% premium to its 10-year average.
In addition, as the chart below illustrates, the SMID segment offers more value today relative to large caps than at any point in the last 15 years, driven by a persistent derating, that was briefly interrupted during Covid due to interest rate cuts, a plunge in small cap profitability, and a surge in liquidity. This derating has led SMID valuations to trade from a peak of a 40% premium to large caps to a nearly double-digit discount today. But remember, valuation is not a catalyst, so some of the three factors detailed above are likely needed to turn favorable in order to see this trend of derating reverse.
“No time to search the world around”: Evaluating SMID Cap Market Structure & The Case for Active Management
While investors have been rewarded for being underweight in the SMID segment in recent years, it remains one of the more compelling markets for active management. This is a result of a less concentrated index, with the top 10 names accounting for just 4% of the total index, compared to 34% for the S&P500, elevated volatility which has historically been 25% higher than in the large cap segment, information inefficiencies as SMID companies have 1/5th the analyst coverage of large caps, and an overall lack of profitability among Russell 2500 Index constituents as on average 30% of index constituents do not generate positive earnings. These structural characteristics and inefficiencies make a strong case for the use of active management in the SMID space as they create robust opportunities for fundamental security selection.
The broad universe of SMID companies is roughly evenly split between value and growth segments, and the median market cap of the Russell 2500 index is about $8B, however certain lower quality industry groups tend to have an outsized influence on the index, including capital goods producers, biotech companies, and regional banks. Applying fundamental security selection in these groups given their structural headwinds to consistent profitability creates opportunities for investors prioritizing consistent earnings growth, which is the dominant driver of long-term performance.
“So go do what you like, make sure you do it wise”: Closing Thoughts
The underperformance of the SMID segment over the past several years has been well documented, and investors today are certainly more respectful of the economic and interest rate sensitivity of this market. As a result, this segment has seen persistent outflows and increasingly negative sentiment by many market participants, conditions which can lead to countertrend rallies in the near-term, until longer term support arrives through a shift in the key factors we noted.
While we do see headwinds continuing for the SMID segment, we believe these are more appreciated by the market today and are increasingly reflected in current valuations. As a result, we are closely watching for a shift in any of our key factors that would warrant a shift in our positioning. From an implementation perspective, we think investors should emphasize active management in the SMID space, with a bias towards quality factors like consistent profitability, reduced interest rate sensitivity, and strong balance sheets, characteristics that can allow these companies better weather the prevailing macro environment, while in the long-term offering exposure to companies that have the potential to grow into future members of the S&P500.
The views and opinions included in these materials belong to their author and do not necessarily reflect the views and opinions of NewEdge Capital Group, LLC.
This information is general in nature and has been prepared solely for informational and educational purposes and does not constitute an offer or a recommendation to buy or sell any particular security or to adopt any specific investment strategy.
NewEdge and its affiliates do not render advice on legal, tax and/or tax accounting matters. You should consult your personal tax and/or legal advisor to learn about any potential tax or other implications that may result from acting on a particular recommendation.
The trademarks and service marks contained herein are the property of their respective owners. Unless otherwise specifically indicated, all information with respect to any third party not affiliated with NewEdge has been provided by, and is the sole responsibility of, such third party and has not been independently verified by NewEdge, its affiliates or any other independent third party. No representation is given with respect to its accuracy or completeness, and such information and opinions may change without notice.
Investing involves risk, including possible loss of principal. Past performance is no guarantee of future results.
Any forward-looking statements or forecasts are based on assumptions and actual results are expected to vary from any such statements or forecasts. No assurance can be given that investment objectives or target returns will be achieved. Future returns may be higher or lower than the estimates presented herein.
An investment cannot be made directly in an index. Indices are unmanaged and have no fees or expenses. You can obtain information about many indices online at a variety of sources including: https://www.sec.gov/answers/indices.htm.
All data is subject to change without notice.
© 2025 NewEdge Capital Group, LLC


